Estimated Value: $443,000 - $476,000
4
Beds
3
Baths
1,998
Sq Ft
$232/Sq Ft
Est. Value
About This Home
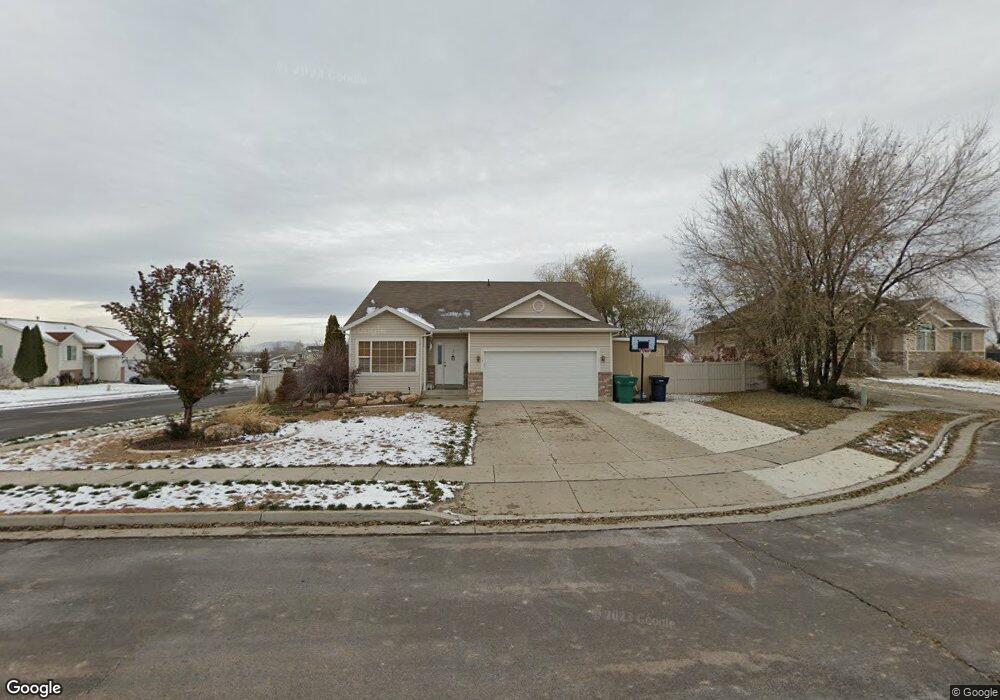
This home is located at 4043 Lily Dr, Roy, UT 84067 and is currently estimated at $463,494, approximately $231 per square foot. 4043 Lily Dr is a home located in Weber County with nearby schools including Valley View School, Sand Ridge Junior High School, and Roy High School.
Ownership History
Date
Name
Owned For
Owner Type
Purchase Details
Closed on
Aug 23, 2021
Sold by
Lucas Saralyn and Estate Of Nola K Spicer
Bought by
Spicer Kent Christopher and Spicer Margaret
Current Estimated Value
Home Financials for this Owner
Home Financials are based on the most recent Mortgage that was taken out on this home.
Original Mortgage
$352,000
Outstanding Balance
$319,595
Interest Rate
2.8%
Mortgage Type
New Conventional
Estimated Equity
$143,899
Purchase Details
Closed on
Apr 13, 2020
Sold by
Osborne Chad E
Bought by
Spicer Nola K
Home Financials for this Owner
Home Financials are based on the most recent Mortgage that was taken out on this home.
Original Mortgage
$110,000
Interest Rate
3.2%
Mortgage Type
New Conventional
Purchase Details
Closed on
Jun 26, 2019
Sold by
Osborne Jennifer
Bought by
Osborne Chad E
Home Financials for this Owner
Home Financials are based on the most recent Mortgage that was taken out on this home.
Original Mortgage
$185,000
Interest Rate
3.7%
Purchase Details
Closed on
Aug 26, 2016
Sold by
Ospborne Chad E
Bought by
Osbeorne Chad E and Osbeorne Jennifer
Home Financials for this Owner
Home Financials are based on the most recent Mortgage that was taken out on this home.
Original Mortgage
$185,000
Interest Rate
3.45%
Mortgage Type
New Conventional
Purchase Details
Closed on
Oct 5, 2011
Sold by
King David
Bought by
Osborne Chad E
Home Financials for this Owner
Home Financials are based on the most recent Mortgage that was taken out on this home.
Original Mortgage
$6,750
Interest Rate
4.16%
Mortgage Type
Stand Alone Second
Purchase Details
Closed on
Mar 12, 2010
Sold by
Pace Jennifer L
Bought by
King David
Purchase Details
Closed on
Jul 9, 2008
Sold by
King David
Bought by
King David and Pace Jennifer L
Home Financials for this Owner
Home Financials are based on the most recent Mortgage that was taken out on this home.
Original Mortgage
$194,940
Interest Rate
6.04%
Mortgage Type
New Conventional
Purchase Details
Closed on
Mar 30, 2004
Sold by
Smith James D and Smith Heather L
Bought by
Rodriguez Kody H
Purchase Details
Closed on
Jun 23, 2003
Sold by
Nilson & Co Inc
Bought by
Smith James D and Smith Heather L
Home Financials for this Owner
Home Financials are based on the most recent Mortgage that was taken out on this home.
Original Mortgage
$112,542
Interest Rate
5.37%
Mortgage Type
Purchase Money Mortgage
Create a Home Valuation Report for This Property
The Home Valuation Report is an in-depth analysis detailing your home's value as well as a comparison with similar homes in the area
Home Values in the Area
Average Home Value in this Area
Purchase History
| Date | Buyer | Sale Price | Title Company |
|---|---|---|---|
| Spicer Kent Christopher | -- | Us Title Insurance Agency | |
| Spicer Nola K | -- | Us Title Insurance Agency | |
| Osborne Chad E | -- | Hickman Land Title Layton | |
| Osbeorne Chad E | -- | Hickman Land Title Co | |
| Osborne Chad E | -- | Hickman Land Title Company | |
| King David | -- | Accommodation | |
| King David | -- | Us Title Utah | |
| Rodriguez Kody H | -- | Bonneville Title | |
| Smith James D | -- | Bonneville Title |
Source: Public Records
Mortgage History
| Date | Status | Borrower | Loan Amount |
|---|---|---|---|
| Open | Spicer Kent Christopher | $352,000 | |
| Previous Owner | Spicer Nola K | $110,000 | |
| Previous Owner | Osborne Chad E | $185,000 | |
| Previous Owner | Osbeorne Chad E | $185,000 | |
| Previous Owner | Osborne Chad E | $6,750 | |
| Previous Owner | Osborne Chad E | $141,324 | |
| Previous Owner | King David | $194,940 | |
| Previous Owner | Smith James D | $112,542 |
Source: Public Records
Tax History Compared to Growth
Tax History
| Year | Tax Paid | Tax Assessment Tax Assessment Total Assessment is a certain percentage of the fair market value that is determined by local assessors to be the total taxable value of land and additions on the property. | Land | Improvement |
|---|---|---|---|---|
| 2025 | $2,728 | $434,385 | $140,308 | $294,077 |
| 2024 | $2,611 | $229,899 | $77,169 | $152,730 |
| 2023 | $2,436 | $213,950 | $72,635 | $141,315 |
| 2022 | $2,787 | $255,200 | $61,766 | $193,434 |
| 2021 | $2,173 | $325,000 | $77,323 | $247,677 |
| 2020 | $2,125 | $293,000 | $77,323 | $215,677 |
| 2019 | $2,114 | $275,000 | $51,830 | $223,170 |
| 2018 | $1,936 | $236,000 | $46,848 | $189,152 |
| 2017 | $1,824 | $208,000 | $44,899 | $163,101 |
| 2016 | $1,702 | $103,989 | $25,468 | $78,521 |
| 2015 | $1,590 | $99,416 | $25,468 | $73,948 |
| 2014 | $1,457 | $89,072 | $22,658 | $66,414 |
Source: Public Records
Map
Nearby Homes
- 4118 Westlake Dr
- 4022 S 2725 W
- 4164 S 2400 W
- 2778 W 4175 S Unit 235
- 3860 S Midland Dr Unit B97
- 3860 S Midland Dr Unit B59
- 3860 S Midland Dr Unit B 51
- 2777 W 4175 S Unit 229
- 4110 S 2275 W
- 3860 Midland Dr Unit C10
- 3860 Midland Dr Unit B32
- 3965 S 2225 W
- 3750 S Midland Dr
- 3750 Midland Dr Unit 169
- 4073 S 2175 W
- 2835 W 4200 S
- 2802 W 4375 S
- 2917 W 3970 S Unit 53
- 2642 W 4400 S
- 2816 W 4400 S