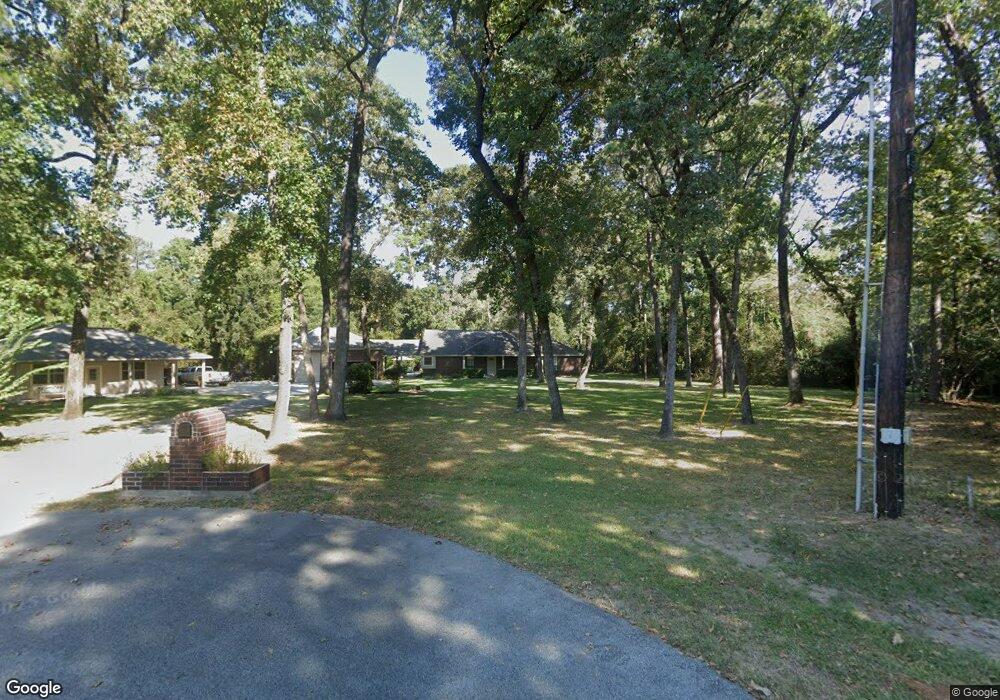
40430 Three Forks Rd Magnolia, TX 77354
Estimated Value: $494,000 - $585,000
--
Bed
3
Baths
2,116
Sq Ft
$262/Sq Ft
Est. Value
About This Home
This home is located at 40430 Three Forks Rd, Magnolia, TX 77354 and is currently estimated at $555,348, approximately $262 per square foot. 40430 Three Forks Rd is a home located in Montgomery County with nearby schools including Bear Branch Elementary School, Bear Branch Junior High School, and Magnolia High School.
Ownership History
Date
Name
Owned For
Owner Type
Purchase Details
Closed on
Jul 11, 1997
Sold by
Johnson Charles B and Johnson Shirley P
Bought by
Harris Neil B and Harris Kelly A
Current Estimated Value
Home Financials for this Owner
Home Financials are based on the most recent Mortgage that was taken out on this home.
Original Mortgage
$46,500
Interest Rate
7.85%
Purchase Details
Closed on
May 22, 1996
Sold by
Hannon James A and Hannon Lela V
Bought by
Harris Neil B
Purchase Details
Closed on
Apr 22, 1996
Sold by
Hannon James A and Hannon Lela V
Bought by
Johnson Charles B and Johnson Shirley P
Purchase Details
Closed on
Jan 4, 1994
Sold by
Ellis Jim
Bought by
Hannon James A and Hannon Lela V
Purchase Details
Closed on
Feb 1, 1990
Sold by
Savings Of America Reo
Bought by
Harris Neil B
Create a Home Valuation Report for This Property
The Home Valuation Report is an in-depth analysis detailing your home's value as well as a comparison with similar homes in the area
Home Values in the Area
Average Home Value in this Area
Purchase History
| Date | Buyer | Sale Price | Title Company |
|---|---|---|---|
| Harris Neil B | -- | American Title Co | |
| Harris Neil B | -- | -- | |
| Johnson Charles B | -- | -- | |
| Hannon James A | -- | Title Agency #50 | |
| Harris Neil B | -- | -- |
Source: Public Records
Mortgage History
| Date | Status | Borrower | Loan Amount |
|---|---|---|---|
| Closed | Harris Neil B | $46,500 |
Source: Public Records
Tax History Compared to Growth
Tax History
| Year | Tax Paid | Tax Assessment Tax Assessment Total Assessment is a certain percentage of the fair market value that is determined by local assessors to be the total taxable value of land and additions on the property. | Land | Improvement |
|---|---|---|---|---|
| 2025 | $6,322 | $522,680 | $136,720 | $385,960 |
| 2024 | $5,645 | $489,115 | -- | -- |
| 2023 | $5,645 | $444,650 | $136,720 | $342,530 |
| 2022 | $7,133 | $404,230 | $143,110 | $305,040 |
| 2021 | $6,830 | $367,480 | $82,720 | $284,760 |
| 2020 | $7,257 | $358,580 | $82,720 | $275,860 |
| 2019 | $6,645 | $329,950 | $82,720 | $247,230 |
| 2018 | $5,477 | $290,130 | $82,720 | $207,410 |
| 2017 | $6,176 | $291,250 | $52,480 | $238,770 |
| 2016 | $6,235 | $294,050 | $52,480 | $249,620 |
| 2015 | $4,998 | $267,320 | $52,480 | $224,800 |
| 2014 | $4,998 | $243,020 | $52,480 | $193,800 |
Source: Public Records
Map
Nearby Homes
- 40319 Three Forks Rd
- 8710 Linn Ln
- 40207 Cimarron Way
- 40108 Cimarron Way
- 40317 De Sota Rd
- 40206 Colfax Rd
- 40715 Pipestone Rd
- 39526 Cimarron Way
- 7022 Dillon Dr
- 7119 Durango Dr
- 7010 Durango Dr
- 7455 Durango Creek Dr
- TBD Boars Head
- TBD Windmill
- 6906 Grant Dr
- 8910 Diamante Dr
- 3005 Windmill Ln
- 6902 Woodland Oaks
- 39414 Lago Dr
- 9322 Sendera Dr
- 40810 Roundup Rd
- 40606 Roundup Rd
- 40423 Three Forks Rd
- 40426 Three Forks Rd
- 40710 Roundup Rd
- 40818 Roundup Rd
- 40518 Roundup Rd
- 40418 Three Forks Rd
- 40419 Three Forks Rd
- 40510 Roundup Rd
- 40807 Roundup Rd
- 40719 Roundup Rd
- 40902 Roundup Rd
- 40821 Roundup Rd
- 40609 Roundup Rd
- 40801 Roundup Rd
- 40411 Three Forks Rd
- 40517 Roundup Rd
- 8714 Linn Ln
- 40703 Roundup Rd