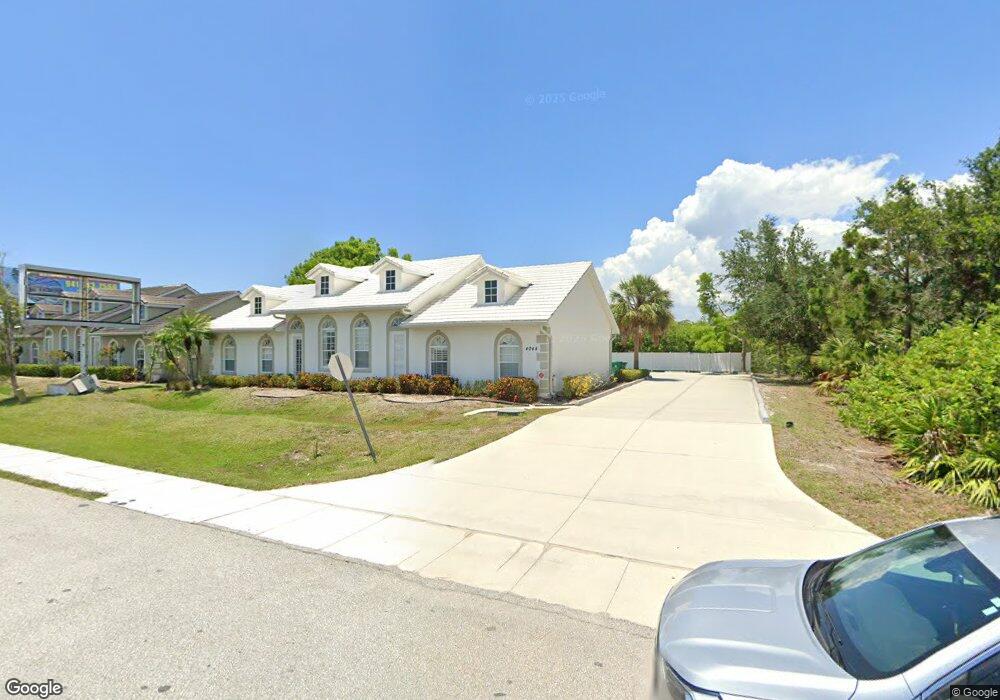
4044 N Access Rd Englewood, FL 34224
Englewood East NeighborhoodEstimated Value: $402,657
--
Bed
2
Baths
2,176
Sq Ft
$185/Sq Ft
Est. Value
About This Home
This home is located at 4044 N Access Rd, Englewood, FL 34224 and is currently estimated at $402,657, approximately $185 per square foot. 4044 N Access Rd is a home located in Charlotte County with nearby schools including Myakka River Elementary School, L.A. Ainger Middle School, and Lemon Bay High School.
Ownership History
Date
Name
Owned For
Owner Type
Purchase Details
Closed on
Sep 12, 2023
Sold by
Gaspar Properties Unlimited Llc
Bought by
Suncoast One Holdings Llc
Current Estimated Value
Home Financials for this Owner
Home Financials are based on the most recent Mortgage that was taken out on this home.
Original Mortgage
$380,000
Outstanding Balance
$367,773
Interest Rate
6.9%
Mortgage Type
New Conventional
Estimated Equity
$34,884
Purchase Details
Closed on
Apr 1, 2017
Bought by
Gaspar Properties Unlimited Ll
Purchase Details
Closed on
Jan 19, 2017
Sold by
Shepard Robert G
Bought by
Gaspar Properites Unlimited Llc
Home Financials for this Owner
Home Financials are based on the most recent Mortgage that was taken out on this home.
Original Mortgage
$167,750
Interest Rate
4.3%
Mortgage Type
Commercial
Purchase Details
Closed on
Feb 7, 2005
Sold by
Lyons Thomas J and Lyons Kathleen M
Bought by
Johnson Joshua C and Johnson Cindy
Create a Home Valuation Report for This Property
The Home Valuation Report is an in-depth analysis detailing your home's value as well as a comparison with similar homes in the area
Home Values in the Area
Average Home Value in this Area
Purchase History
| Date | Buyer | Sale Price | Title Company |
|---|---|---|---|
| Suncoast One Holdings Llc | $475,000 | Suncoast One Title & Closings | |
| Gaspar Properties Unlimited Ll | $100 | -- | |
| Gaspar Properites Unlimited Llc | $225,000 | None Available | |
| Johnson Joshua C | $65,000 | Aaction Title Agency Inc |
Source: Public Records
Mortgage History
| Date | Status | Borrower | Loan Amount |
|---|---|---|---|
| Open | Suncoast One Holdings Llc | $380,000 | |
| Previous Owner | Gaspar Properites Unlimited Llc | $167,750 |
Source: Public Records
Tax History Compared to Growth
Tax History
| Year | Tax Paid | Tax Assessment Tax Assessment Total Assessment is a certain percentage of the fair market value that is determined by local assessors to be the total taxable value of land and additions on the property. | Land | Improvement |
|---|---|---|---|---|
| 2024 | $5,847 | $355,691 | $82,875 | $272,816 |
| 2023 | $5,847 | $247,507 | $0 | $0 |
| 2022 | $4,860 | $238,628 | $47,813 | $190,815 |
| 2021 | $4,531 | $204,551 | $37,613 | $166,938 |
| 2020 | $4,362 | $207,145 | $46,538 | $160,607 |
| 2019 | $4,066 | $188,584 | $38,250 | $150,334 |
| 2018 | $3,743 | $186,474 | $38,250 | $148,224 |
| 2017 | $3,619 | $177,309 | $31,875 | $145,434 |
| 2016 | $3,644 | $176,414 | $0 | $0 |
| 2015 | $3,940 | $191,761 | $0 | $0 |
| 2014 | $3,971 | $193,888 | $0 | $0 |
Source: Public Records
Map
Nearby Homes
- 10419 Kidron Ave Unit B
- 10436 Kidron Ave
- 10475 Kidron Ave
- 6361 Shaw St
- 10490 Pendleton Ave
- 10419 Pendleton Ave
- 6353 Sunnybrook Blvd
- 6977 Hawksbury St
- 10411 Pendleton Ave
- 11200 Pendleton Ave
- 10506 Pendleton Ave
- 10434 Pendleton Ave
- 6985 Hawksbury St
- 6312 Sunnybrook Blvd
- 6305 Shaw St
- 7025 Lauretta St
- 11050 Reims Ave
- 10418 Carnegie Ave
- 11082 Carnegie Ave
- 10310 Deerwood Ave
- 4032 N Access Rd
- 4056 N Access Rd
- 10459 Kidron Ave Unit 2
- 10459 Kidron Ave
- 4024 N Access Rd
- 10451 Kidron Ave
- 4020 N Access Rd
- 4020 N Access Rd
- 10435 Kidron Ave Unit 10435
- 4045 S Mccall Rd
- 10452 Kidron Ave
- 10452 Kidron Ave Unit B
- 10452 Kidron Ave Unit A
- 10452 Kidron Ave
- 10452 Kidron Ave Unit A & B
- 10460 Kidron Ave
- 10460 Kidron Ave Unit 2
- 4012 N Access Rd
- 10446 Kidron Ave
- 10444 Kidron Ave