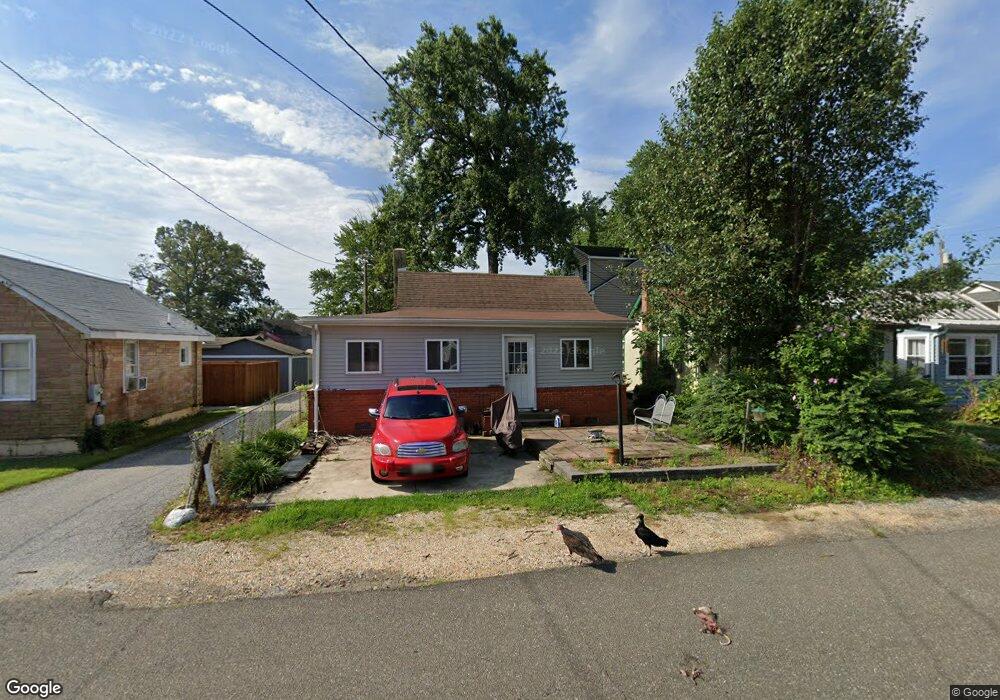
4045 1st St Chesapeake Beach, MD 20732
Estimated Value: $245,956 - $329,000
--
Bed
1
Bath
588
Sq Ft
$482/Sq Ft
Est. Value
About This Home
This home is located at 4045 1st St, Chesapeake Beach, MD 20732 and is currently estimated at $283,239, approximately $481 per square foot. 4045 1st St is a home located in Calvert County with nearby schools including Windy Hill Elementary School, Windy Hill Middle School, and Northern High School.
Ownership History
Date
Name
Owned For
Owner Type
Purchase Details
Closed on
Jul 7, 1999
Sold by
Osborn Michael K
Bought by
Bever Thomas B
Current Estimated Value
Purchase Details
Closed on
Mar 3, 1993
Sold by
Vest Edward Nelson and Vest Lucia
Bought by
Osborn Michael K
Home Financials for this Owner
Home Financials are based on the most recent Mortgage that was taken out on this home.
Original Mortgage
$67,900
Interest Rate
7.53%
Create a Home Valuation Report for This Property
The Home Valuation Report is an in-depth analysis detailing your home's value as well as a comparison with similar homes in the area
Home Values in the Area
Average Home Value in this Area
Purchase History
| Date | Buyer | Sale Price | Title Company |
|---|---|---|---|
| Bever Thomas B | $89,900 | -- | |
| Osborn Michael K | $67,900 | -- |
Source: Public Records
Mortgage History
| Date | Status | Borrower | Loan Amount |
|---|---|---|---|
| Previous Owner | Osborn Michael K | $67,900 | |
| Closed | Bever Thomas B | -- |
Source: Public Records
Tax History Compared to Growth
Tax History
| Year | Tax Paid | Tax Assessment Tax Assessment Total Assessment is a certain percentage of the fair market value that is determined by local assessors to be the total taxable value of land and additions on the property. | Land | Improvement |
|---|---|---|---|---|
| 2025 | $1,888 | $173,900 | $90,700 | $83,200 |
| 2024 | $1,888 | $166,333 | $0 | $0 |
| 2023 | $1,743 | $158,767 | $0 | $0 |
| 2022 | $474 | $151,200 | $90,700 | $60,500 |
| 2021 | $1,693 | $150,100 | $0 | $0 |
| 2020 | $1,693 | $149,000 | $0 | $0 |
| 2019 | $414 | $147,900 | $90,700 | $57,200 |
| 2018 | $383 | $147,900 | $90,700 | $57,200 |
| 2017 | $377 | $147,900 | $0 | $0 |
| 2016 | -- | $149,300 | $0 | $0 |
| 2015 | -- | $149,300 | $0 | $0 |
| 2014 | -- | $149,300 | $0 | $0 |
Source: Public Records
Map
Nearby Homes