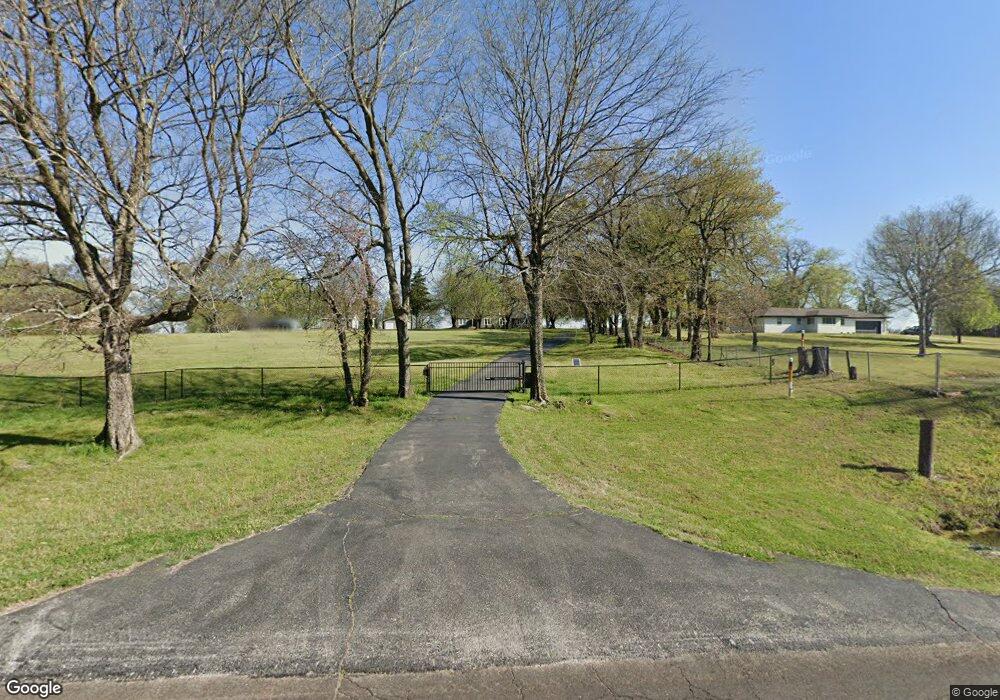
4045 E 76th St N Sperry, OK 74073
Estimated Value: $244,426 - $312,000
3
Beds
2
Baths
1,824
Sq Ft
$159/Sq Ft
Est. Value
About This Home
This home is located at 4045 E 76th St N, Sperry, OK 74073 and is currently estimated at $289,607, approximately $158 per square foot. 4045 E 76th St N is a home located in Tulsa County with nearby schools including Barnes Elementary School, Owasso 6th Grade Center, and Owasso 7th Grade Center.
Ownership History
Date
Name
Owned For
Owner Type
Purchase Details
Closed on
May 22, 2006
Sold by
Davidson David L and Davidson Mary R
Bought by
Davidson David L and Davidson Mary R
Current Estimated Value
Purchase Details
Closed on
Oct 29, 2004
Sold by
Watkins Wanda and Watkins Byron
Bought by
Davidson David L and Davidson Mary R
Home Financials for this Owner
Home Financials are based on the most recent Mortgage that was taken out on this home.
Original Mortgage
$61,600
Interest Rate
5.71%
Mortgage Type
New Conventional
Create a Home Valuation Report for This Property
The Home Valuation Report is an in-depth analysis detailing your home's value as well as a comparison with similar homes in the area
Purchase History
| Date | Buyer | Sale Price | Title Company |
|---|---|---|---|
| Davidson David L | -- | None Available | |
| Davidson David L | -- | Capitol Abstract & Title Co |
Source: Public Records
Mortgage History
| Date | Status | Borrower | Loan Amount |
|---|---|---|---|
| Closed | Davidson David L | $61,600 |
Source: Public Records
Tax History
| Year | Tax Paid | Tax Assessment Tax Assessment Total Assessment is a certain percentage of the fair market value that is determined by local assessors to be the total taxable value of land and additions on the property. | Land | Improvement |
|---|---|---|---|---|
| 2025 | $1,266 | $11,232 | $3,010 | $8,222 |
| 2024 | $1,771 | $16,788 | $1,955 | $14,833 |
| 2023 | $1,771 | $17,270 | $3,278 | $13,992 |
| 2022 | $1,849 | $16,270 | $3,088 | $13,182 |
| 2021 | $1,831 | $16,270 | $3,088 | $13,182 |
| 2020 | $1,828 | $16,270 | $3,088 | $13,182 |
| 2019 | $1,820 | $16,270 | $3,088 | $13,182 |
| 2018 | $1,763 | $16,270 | $3,088 | $13,182 |
| 2017 | $1,770 | $17,270 | $3,278 | $13,992 |
| 2016 | $1,772 | $17,270 | $3,278 | $13,992 |
| 2015 | $1,892 | $17,270 | $3,278 | $13,992 |
| 2014 | $1,908 | $17,270 | $3,278 | $13,992 |
Source: Public Records
Map
Nearby Homes
- 4704 E 76th St N
- 7716 N Harvard Ave
- 5007 E 82nd St N
- 3951 E 86th St N
- 8705 N Harvard Ave
- 5303 E 86th St N
- 4620 E 66th St N
- 7668 N Harvard Ave E
- 8136 N 68th East Place
- 6317 E 88th St N
- 2721 E 61st St N
- 8432 N 68th East Ave
- 8901 N 63rd East Ave
- 5944 N Evanston Ave
- 1712 E 71st St N
- 6708 E 88th St N
- 8350 N 72nd East Ave
- 7404 E 83rd St N
- 7406 E 83rd Place N
- 7414 E 83rd St N
- 4049 E 76th St N
- 3905 E 76th St N
- 7625 N 38th East Ave
- 4016 E 76th St N
- 7630 N 38th East Ave
- 7535 N Pittsburg Ave
- 3914 E 76th St N
- 7525 N Pittsburg Ave
- 3701 E 76th St N
- 3630 E 76th St N
- 4310 E 76th St N
- 3341 E 76th St N
- 3610 E 76th St N
- 7315 N Pittsburg Ave
- 4702 E 76th St N
- 1401 N Harvard Ave
- 0 N Harvard Ave
- 3701 N Harvard Ave
- 7590 N Harvard Ave E
- 6924 N Pittsburg Ave
Your Personal Tour Guide
Ask me questions while you tour the home.