Estimated Value: $1,153,000 - $2,217,000
3
Beds
2
Baths
480
Sq Ft
$3,056/Sq Ft
Est. Value
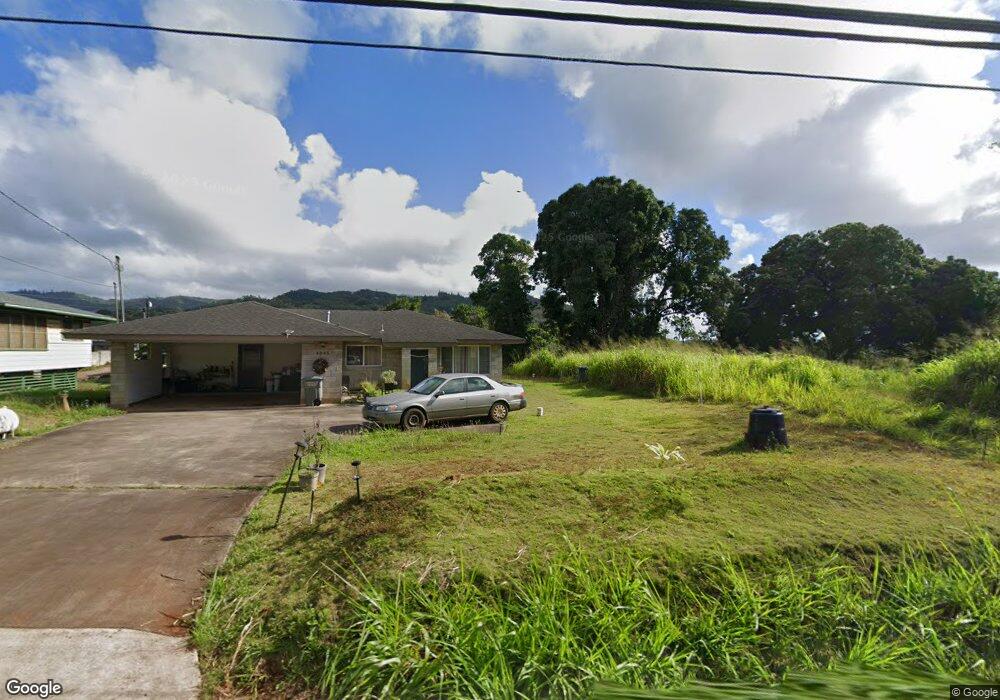
About This Home
This home is located at 4045 Koloa Rd, Koloa, HI 96756 and is currently estimated at $1,466,861, approximately $3,055 per square foot. 4045 Koloa Rd is a home located in Kauai County with nearby schools including Koloa Elementary School, Chiefess Kamakahelei Middle School, and Kauai High School.
Ownership History
Date
Name
Owned For
Owner Type
Purchase Details
Closed on
Aug 25, 2005
Sold by
Costales Jose and Costales Rose Marie C
Bought by
Costales Jose and Costales Michele T C
Current Estimated Value
Purchase Details
Closed on
Oct 3, 2003
Sold by
Costales Jonathan E
Bought by
Costales Jose and Costales Michell T C
Purchase Details
Closed on
Nov 19, 1999
Sold by
Costales Rose Marie C and Costales Jose
Bought by
Costales Jose and Costales Michele T C
Purchase Details
Closed on
Feb 25, 1999
Sold by
Costales Rose Marie C and Costales Jose
Bought by
Costales Jose and Costales Rose Marie C
Purchase Details
Closed on
Apr 25, 1995
Sold by
Costales Rose Marie C and Costales Jose
Bought by
Costales Rose Marie C and Costales Jose
Create a Home Valuation Report for This Property
The Home Valuation Report is an in-depth analysis detailing your home's value as well as a comparison with similar homes in the area
Home Values in the Area
Average Home Value in this Area
Purchase History
| Date | Buyer | Sale Price | Title Company |
|---|---|---|---|
| Costales Jose | -- | Tg | |
| Costales Jose | -- | -- | |
| Costales Jose | -- | -- | |
| Costales Jose | -- | -- | |
| Costales Rose Marie C | -- | -- |
Source: Public Records
Tax History Compared to Growth
Tax History
| Year | Tax Paid | Tax Assessment Tax Assessment Total Assessment is a certain percentage of the fair market value that is determined by local assessors to be the total taxable value of land and additions on the property. | Land | Improvement |
|---|---|---|---|---|
| 2025 | $1,078 | $648,900 | $372,500 | $276,400 |
| 2024 | $1,078 | $630,000 | $339,800 | $290,200 |
| 2023 | $1,186 | $611,700 | $322,000 | $289,700 |
| 2022 | $1,321 | $593,900 | $0 | $0 |
| 2021 | $1,269 | $576,600 | $0 | $0 |
| 2020 | $1,217 | $559,800 | $217,300 | $342,500 |
| 2019 | $1,168 | $543,500 | $178,500 | $365,000 |
| 2018 | $1,119 | $327,700 | $170,200 | $157,500 |
| 2017 | $1,073 | $312,300 | $191,700 | $120,600 |
| 2016 | $1,058 | $307,400 | $201,800 | $105,600 |
| 2015 | $444 | $412,100 | $0 | $0 |
| 2014 | -- | $412,100 | $0 | $0 |
Source: Public Records
Map
Nearby Homes
- 3470 Lawailoa Ln
- 3351 Kalua Moa Rd Unit B
- 4001 Aka Rd
- 3880 Aka Rd
- 3960 Kiani St
- 3307 Hailima Rd Unit A
- 0 Uha Rd Unit 1 723678
- 4600 Uha Rd
- 4373 Upa Rd
- 0 Omao Rd Unit 720988
- 4582 Kuilei St
- 0 Kaumualii Hwy Unit 710235
- 4200 Waha Rd
- 4114 Waha Rd Unit J
- 0 Umiumi Rd
- 4288 Umiumi Rd Unit D
- 3661 Papalina Rd Unit A
- 3215 Wawae Rd
- 3198 Wawae Rd
- 3942 Waha Rd