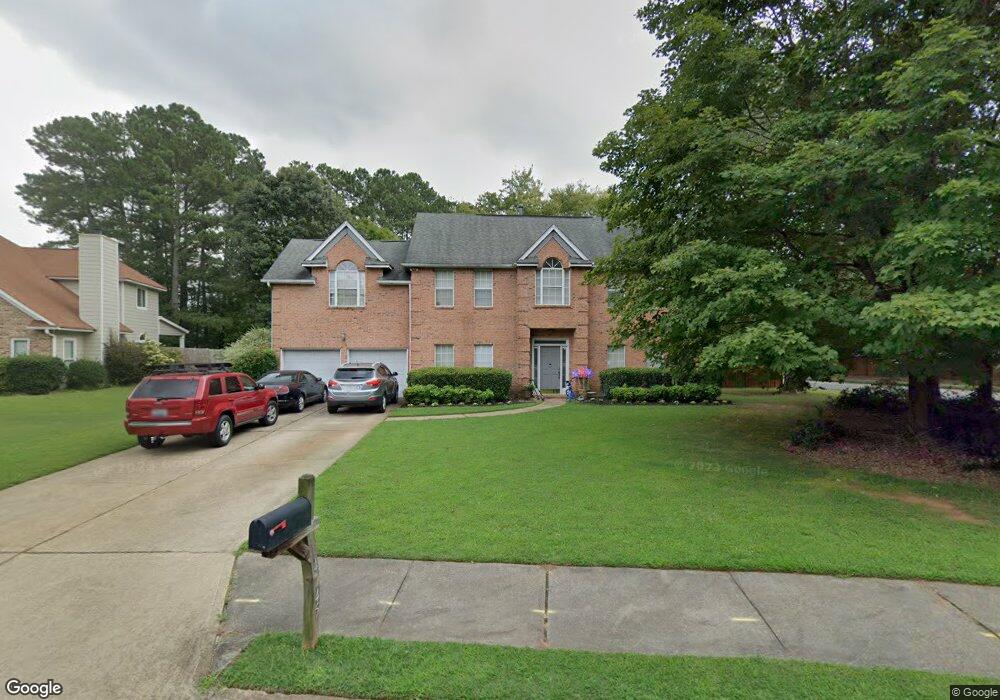
4045 Pineset Dr Alpharetta, GA 30022
Estimated Value: $623,000 - $679,000
4
Beds
3
Baths
3,004
Sq Ft
$217/Sq Ft
Est. Value
About This Home
This home is located at 4045 Pineset Dr, Alpharetta, GA 30022 and is currently estimated at $652,188, approximately $217 per square foot. 4045 Pineset Dr is a home located in Fulton County with nearby schools including Ocee Elementary School, Taylor Road Middle School, and Chattahoochee High School.
Ownership History
Date
Name
Owned For
Owner Type
Purchase Details
Closed on
May 29, 2007
Sold by
Di-Langosco Massimiliano L and Di-Langosco Ingrid L
Bought by
Hu Xianbo and Zhai Xiaowen
Current Estimated Value
Home Financials for this Owner
Home Financials are based on the most recent Mortgage that was taken out on this home.
Original Mortgage
$212,000
Outstanding Balance
$129,229
Interest Rate
6.12%
Mortgage Type
New Conventional
Estimated Equity
$522,959
Purchase Details
Closed on
Nov 25, 2003
Sold by
Langosco and Langosco Di
Bought by
Langosco and Langosco Di
Home Financials for this Owner
Home Financials are based on the most recent Mortgage that was taken out on this home.
Original Mortgage
$205,200
Interest Rate
5.98%
Mortgage Type
New Conventional
Purchase Details
Closed on
Aug 24, 1995
Sold by
Lopez Edgardo Yvonne C
Bought by
Truesdell Alan Sheryl A
Create a Home Valuation Report for This Property
The Home Valuation Report is an in-depth analysis detailing your home's value as well as a comparison with similar homes in the area
Home Values in the Area
Average Home Value in this Area
Purchase History
| Date | Buyer | Sale Price | Title Company |
|---|---|---|---|
| Hu Xianbo | $265,000 | -- | |
| Langosco | -- | -- | |
| Langosco | $228,000 | -- | |
| Truesdell Alan Sheryl A | $159,000 | -- |
Source: Public Records
Mortgage History
| Date | Status | Borrower | Loan Amount |
|---|---|---|---|
| Open | Hu Xianbo | $212,000 | |
| Previous Owner | Langosco | $205,200 | |
| Closed | Truesdell Alan Sheryl A | $0 |
Source: Public Records
Tax History Compared to Growth
Tax History
| Year | Tax Paid | Tax Assessment Tax Assessment Total Assessment is a certain percentage of the fair market value that is determined by local assessors to be the total taxable value of land and additions on the property. | Land | Improvement |
|---|---|---|---|---|
| 2025 | $1,361 | $267,960 | $52,040 | $215,920 |
| 2023 | $6,682 | $236,720 | $50,000 | $186,720 |
| 2022 | $5,082 | $193,160 | $39,040 | $154,120 |
| 2021 | $5,953 | $181,040 | $33,280 | $147,760 |
| 2020 | $5,367 | $160,000 | $32,960 | $127,040 |
| 2019 | $768 | $157,160 | $32,360 | $124,800 |
| 2018 | $3,976 | $140,880 | $27,400 | $113,480 |
| 2017 | $3,153 | $108,080 | $18,600 | $89,480 |
| 2016 | $2,983 | $102,200 | $18,600 | $83,600 |
| 2015 | $3,582 | $102,200 | $18,600 | $83,600 |
| 2014 | $2,663 | $102,200 | $18,600 | $83,600 |
Source: Public Records
Map
Nearby Homes
- 4305 Pine Vista Blvd
- 10945 Pinehigh Dr
- 517 Boardwalk Way
- 515 Boardwalk Way
- 4475 Hawthorn Cir
- 4465 Hawthorn Cir
- 4462 Hawthorn Cir
- 285 Rolling Mist Ct
- 3920 Brookline Dr
- 11125 Pinehigh Dr
- 105 Kimball Bridge Cove
- 3962 Erin Dr
- 4645 Valais Ct Unit 109
- 3965 Brookline Dr
- 11085 State Bridge Rd
- 134 Wards Crossing Way Unit 17
- 115 Willow View Point
- 710 Country Manor Way
- 513 Camden Hall Dr
- 4055 Pineset Dr
- 250 Pinewalk Way
- 115 Piney Hill Trace
- 4065 Pineset Dr
- 305 Pinewalk Way Unit 2
- 125 Piney Hill Trace
- 10890 Pinewalk Forest Cir
- 4040 Pineset Dr Unit 2
- 105 Piney Hill Trace Unit 3A
- 4075 Pineset Dr
- 130 Piney Hill Trace
- 4050 Pineset Dr
- 295 Pinewalk Way
- 240 Pinewalk Way
- 10870 Pinewalk Forest Cir Unit 61
- 10870 Pinewalk Forest Cir
- 0 Pine Isle Ct Unit 7588778
- 0 Pine Isle Ct
- 4085 Pineset Dr
- 4060 Pineset Dr Unit 2