Estimated Value: $497,000 - $527,000
5
Beds
3
Baths
2,202
Sq Ft
$230/Sq Ft
Est. Value
About This Home
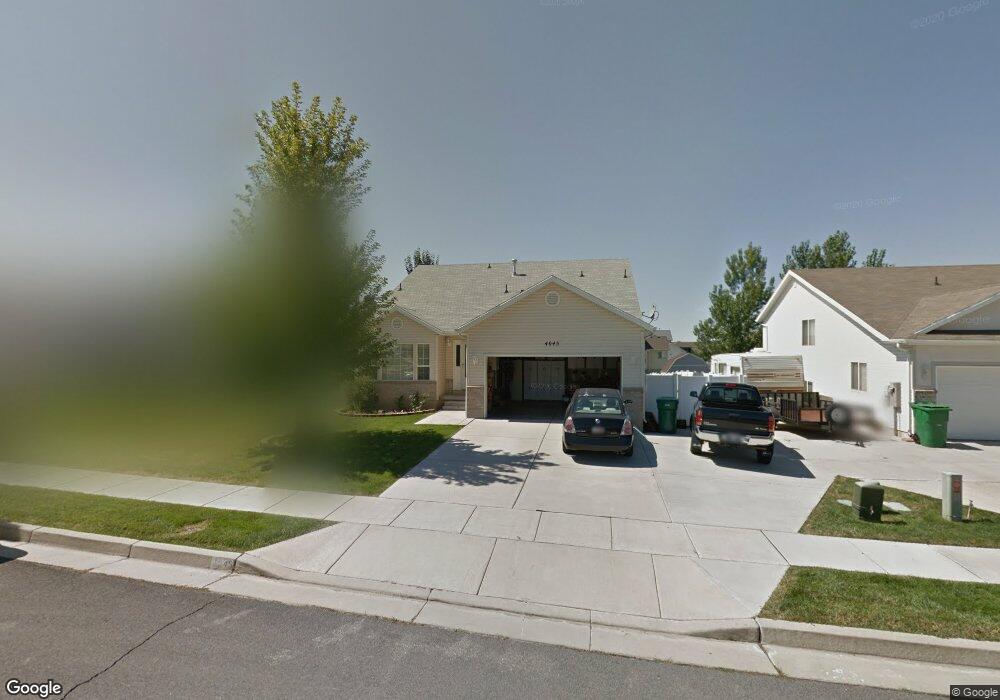
This home is located at 4045 S 2675 W, Roy, UT 84067 and is currently estimated at $507,277, approximately $230 per square foot. 4045 S 2675 W is a home located in Weber County with nearby schools including Valley View School, Sand Ridge Junior High School, and Roy High School.
Ownership History
Date
Name
Owned For
Owner Type
Purchase Details
Closed on
Sep 30, 2024
Sold by
Berendt Thomas
Bought by
Tom Berendt Living Trust and Berendt
Current Estimated Value
Purchase Details
Closed on
Apr 23, 2001
Sold by
Nilson & Company Inc
Bought by
Berendt Thomas and Berendt Tari L
Home Financials for this Owner
Home Financials are based on the most recent Mortgage that was taken out on this home.
Original Mortgage
$113,700
Interest Rate
6.98%
Create a Home Valuation Report for This Property
The Home Valuation Report is an in-depth analysis detailing your home's value as well as a comparison with similar homes in the area
Home Values in the Area
Average Home Value in this Area
Purchase History
| Date | Buyer | Sale Price | Title Company |
|---|---|---|---|
| Tom Berendt Living Trust | -- | None Listed On Document | |
| Berendt Thomas | -- | Bonneville Title Company |
Source: Public Records
Mortgage History
| Date | Status | Borrower | Loan Amount |
|---|---|---|---|
| Previous Owner | Berendt Thomas | $113,700 |
Source: Public Records
Tax History Compared to Growth
Tax History
| Year | Tax Paid | Tax Assessment Tax Assessment Total Assessment is a certain percentage of the fair market value that is determined by local assessors to be the total taxable value of land and additions on the property. | Land | Improvement |
|---|---|---|---|---|
| 2025 | $3,042 | $489,765 | $135,012 | $354,753 |
| 2024 | $2,904 | $258,499 | $74,256 | $184,243 |
| 2023 | $2,554 | $225,500 | $71,317 | $154,183 |
| 2022 | $2,969 | $273,350 | $60,501 | $212,849 |
| 2021 | $2,306 | $347,000 | $75,002 | $271,998 |
| 2020 | $2,258 | $313,000 | $75,002 | $237,998 |
| 2019 | $2,253 | $295,000 | $49,906 | $245,094 |
| 2018 | $2,055 | $252,000 | $44,976 | $207,024 |
| 2017 | $1,933 | $222,000 | $43,029 | $178,971 |
| 2016 | $1,828 | $112,609 | $24,773 | $87,836 |
| 2015 | $1,755 | $111,098 | $24,773 | $86,325 |
| 2014 | $1,615 | $100,166 | $21,944 | $78,222 |
Source: Public Records
Map
Nearby Homes
- 4022 S 2725 W
- 2778 W 4175 S Unit 235
- 2777 W 4175 S Unit 229
- 4118 Westlake Dr
- 3860 S Midland Dr Unit B97
- 3860 S Midland Dr Unit B59
- 3860 S Midland Dr Unit B 51
- 2917 W 3970 S Unit 53
- 2835 W 4200 S
- 3891 S 2940 W
- 3866 S 2970 W
- 2802 W 4375 S
- 3750 S Midland Dr
- 2816 W 4400 S
- 3750 Midland Dr Unit 169
- 4164 S 2400 W
- 2979 W 4275 S
- 3860 Midland Dr Unit C10
- 3860 Midland Dr Unit B32
- 3114 S 3175 W Unit 21