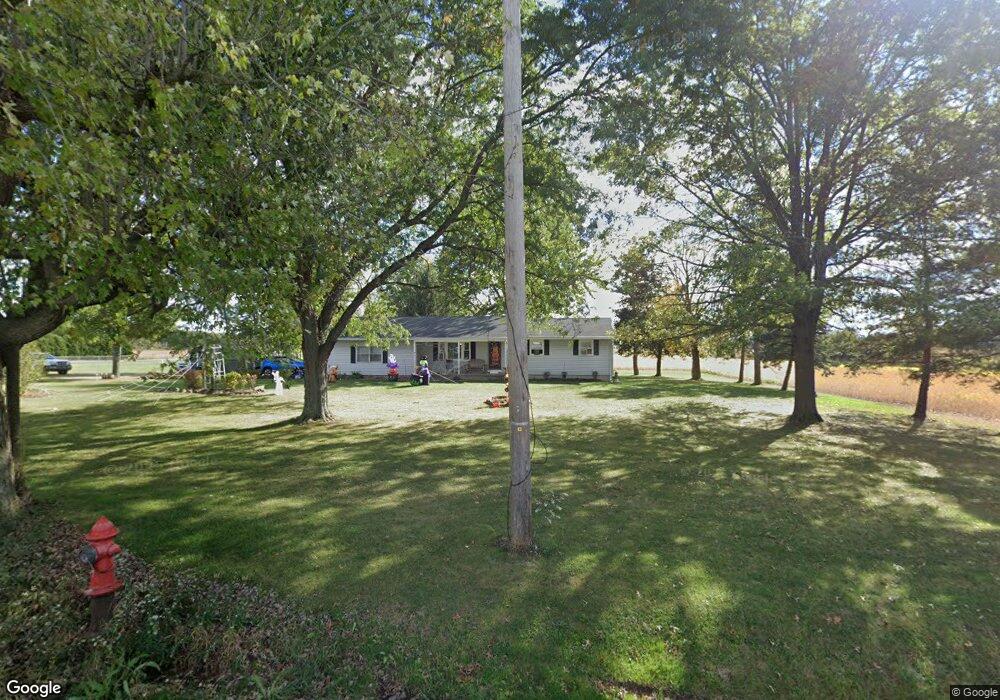
40453 State Route 303 Lagrange, OH 44050
Estimated Value: $268,088 - $308,000
3
Beds
2
Baths
1,792
Sq Ft
$164/Sq Ft
Est. Value
About This Home
This home is located at 40453 State Route 303, Lagrange, OH 44050 and is currently estimated at $294,272, approximately $164 per square foot. 40453 State Route 303 is a home located in Lorain County with nearby schools including Keystone Elementary School, Keystone Middle School, and Keystone High School.
Ownership History
Date
Name
Owned For
Owner Type
Purchase Details
Closed on
Feb 13, 2019
Sold by
Smith Linda
Bought by
Hottenrott Darlene and Hardman Diane
Current Estimated Value
Purchase Details
Closed on
Jul 28, 2018
Sold by
Hottenrott Darlene and Harman Diane
Bought by
Smith Linda
Home Financials for this Owner
Home Financials are based on the most recent Mortgage that was taken out on this home.
Original Mortgage
$125,406
Interest Rate
4.87%
Mortgage Type
FHA
Purchase Details
Closed on
Mar 28, 2009
Sold by
Hottenrott Darlene and Milburn Diane
Bought by
Moulder Robert and Moulder Lisa
Home Financials for this Owner
Home Financials are based on the most recent Mortgage that was taken out on this home.
Original Mortgage
$169,000
Interest Rate
5%
Mortgage Type
Seller Take Back
Create a Home Valuation Report for This Property
The Home Valuation Report is an in-depth analysis detailing your home's value as well as a comparison with similar homes in the area
Home Values in the Area
Average Home Value in this Area
Purchase History
| Date | Buyer | Sale Price | Title Company |
|---|---|---|---|
| Hottenrott Darlene | $146,300 | Timios Inc | |
| Smith Linda | $134,000 | None Available | |
| Moulder Robert | $190,000 | Attorney | |
| Hottenrott Darlene | $246,000 | Attorney |
Source: Public Records
Mortgage History
| Date | Status | Borrower | Loan Amount |
|---|---|---|---|
| Previous Owner | Smith Linda | $125,406 | |
| Previous Owner | Moulder Robert | $169,000 |
Source: Public Records
Tax History
| Year | Tax Paid | Tax Assessment Tax Assessment Total Assessment is a certain percentage of the fair market value that is determined by local assessors to be the total taxable value of land and additions on the property. | Land | Improvement |
|---|---|---|---|---|
| 2024 | $2,716 | $75,688 | $19,670 | $56,018 |
| 2023 | $2,613 | $62,017 | $29,502 | $32,515 |
| 2022 | $3,034 | $62,017 | $29,502 | $32,515 |
| 2021 | $3,034 | $62,017 | $29,502 | $32,515 |
| 2020 | $2,785 | $50,750 | $24,140 | $26,610 |
| 2019 | $2,768 | $50,750 | $24,140 | $26,610 |
| 2018 | $2,801 | $50,750 | $24,140 | $26,610 |
| 2017 | $2,901 | $51,210 | $21,310 | $29,900 |
| 2016 | $2,880 | $51,210 | $21,310 | $29,900 |
| 2015 | $2,875 | $51,210 | $21,310 | $29,900 |
| 2014 | $2,507 | $51,210 | $21,310 | $29,900 |
| 2013 | $2,430 | $51,210 | $21,310 | $29,900 |
Source: Public Records
Map
Nearby Homes
- 110 Railroad St
- 608 Rundle St
- 516 Appomattox Ct
- 548 William St
- 305 W Main St
- 801 Willich Ct
- 800 Buckingham Dr
- 808 Buckingham Dr
- 613 U s Grant St
- 340 Granger Dr
- 40260 Whitney Rd
- 0 Whitehead Rd
- 17058 Chamberlain Rd
- 42113 Meadow Ln
- 14768 Whitehead Rd
- 704 Black Bear Run
- 510 Arabian Ct
- 479 Stallion Ct
- 476 Stallion Ct
- 40175 Banks Rd
- 40476 State Route 303
- 500 E Main St
- 40430 State Route 303
- 40494 State Route 303
- 503 E Main St
- 40399 State Route 303
- 000 Dill Ct
- 40412 State Route 303
- 0 Dill Ct Unit 5072837
- 40380 State Route 303
- 110 Dill Ct
- 443 E Main St
- 40361 State Route 303
- 436 E Main St
- 105 Dill Ct
- 114 Dill Ct
- 112 Dill Ct
- V/L Dill Ct
- 111 Dill Ct
- 111 Dill Ct
Your Personal Tour Guide
Ask me questions while you tour the home.