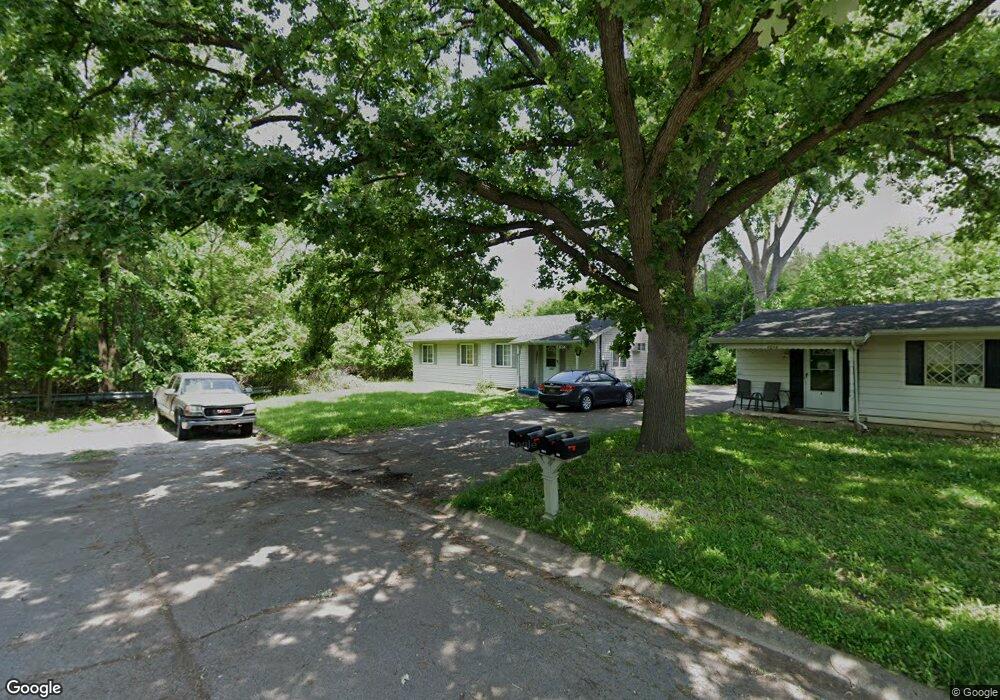
4048 Fraser St Flint, MI 48532
West Court Gardens NeighborhoodEstimated Value: $49,000 - $59,158
2
Beds
2
Baths
1,160
Sq Ft
$48/Sq Ft
Est. Value
About This Home
This home is located at 4048 Fraser St, Flint, MI 48532 and is currently estimated at $55,790, approximately $48 per square foot. 4048 Fraser St is a home located in Genesee County with nearby schools including Durant-Tuuri-Mott Elementary School, St. Paul Lutheran School, and First Flint Seventh-day Adventist Christian School.
Ownership History
Date
Name
Owned For
Owner Type
Purchase Details
Closed on
Nov 27, 2019
Sold by
Cumulus 9 Llc
Bought by
Li Zhaojian
Current Estimated Value
Purchase Details
Closed on
Jun 14, 2018
Sold by
Frazer Apartments Llc
Bought by
Cumulus9 Llc
Purchase Details
Closed on
Nov 5, 2015
Sold by
Walker Justin and Walker Heather
Bought by
Fraser Apartments Llc
Purchase Details
Closed on
Jan 10, 2014
Sold by
Blg Enterprises Llc
Bought by
Walker Justin
Purchase Details
Closed on
May 14, 2013
Sold by
Bbjd Ventures Llc
Bought by
Blg Enterprises Llc
Purchase Details
Closed on
Feb 4, 2013
Sold by
Morris Patrick and Morris Regina
Bought by
Bbjd Ventures Llc
Purchase Details
Closed on
Aug 31, 2005
Sold by
Brayan Mary Lou and Brayan Paul
Bought by
Morris Patrick and Morris Regina
Create a Home Valuation Report for This Property
The Home Valuation Report is an in-depth analysis detailing your home's value as well as a comparison with similar homes in the area
Home Values in the Area
Average Home Value in this Area
Purchase History
| Date | Buyer | Sale Price | Title Company |
|---|---|---|---|
| Li Zhaojian | $92,000 | Cislo Title Company | |
| Cumulus9 Llc | $32,000 | Lihgthouse Title Inc | |
| Fraser Apartments Llc | -- | Attorney | |
| Walker Justin | $15,500 | Lighthouse Title Inc | |
| Blg Enterprises Llc | $20,000 | Mason Burgess Title | |
| Bbjd Ventures Llc | -- | None Available | |
| Morris Patrick | $55,000 | Metropolitan Title Company |
Source: Public Records
Tax History
| Year | Tax Paid | Tax Assessment Tax Assessment Total Assessment is a certain percentage of the fair market value that is determined by local assessors to be the total taxable value of land and additions on the property. | Land | Improvement |
|---|---|---|---|---|
| 2025 | $1,557 | $22,900 | $0 | $0 |
| 2024 | $1,452 | $22,900 | $0 | $0 |
| 2023 | $1,420 | $20,300 | $0 | $0 |
| 2022 | $0 | $18,300 | $0 | $0 |
| 2021 | $1,404 | $17,700 | $0 | $0 |
| 2020 | $1,300 | $13,200 | $0 | $0 |
| 2019 | $960 | $10,700 | $0 | $0 |
| 2018 | $912 | $11,800 | $0 | $0 |
| 2017 | $888 | $0 | $0 | $0 |
| 2016 | $882 | $0 | $0 | $0 |
| 2015 | -- | $0 | $0 | $0 |
| 2014 | -- | $0 | $0 | $0 |
| 2012 | -- | $11,800 | $0 | $0 |
Source: Public Records
Map
Nearby Homes
- 863 Tacken St
- 870 Tacken St
- 874 Tacken St
- 0000 Beecher Rd
- 3709 Brentwood Dr
- 3517 Norwood Dr
- 3302 Van Buren Ave
- 3320 Timberview St
- 3288 Tall Oaks Ct
- 3309 Beecher Rd
- 3522 Ridgecliffe Dr
- 3617 Sherwood Dr
- 916 Mann Ave
- 3493 Ridgecliffe Dr
- 3365 Ridgecliffe Dr
- 3405 Sherwood Dr
- 976 Barney Ave
- 960 Mann Ave
- 3350 Beecher Rd
- 3360 Beecher Rd
- 4044 4048 Frazer St
- 4048 Frazer St
- 4044 Fraser St
- 4044 Frazer St
- 4036 Fraser St
- 4033 Fraser St
- 4028 Fraser St
- 4041 Fraser St
- 4029 Fraser St
- 4020 Frazer St
- 4020 Fraser St
- 4019 Frazer St
- 4023 Fraser St
- 4019 Fraser St
- 4016 Frazer St
- 4016 Fraser St
- 4012 Fraser St
- 4018 Jacque St
- 4010 Jacque St
- 4002 Jacque St
Your Personal Tour Guide
Ask me questions while you tour the home.