Estimated Value: $574,000 - $672,646
3
Beds
3
Baths
1,658
Sq Ft
$375/Sq Ft
Est. Value
About This Home
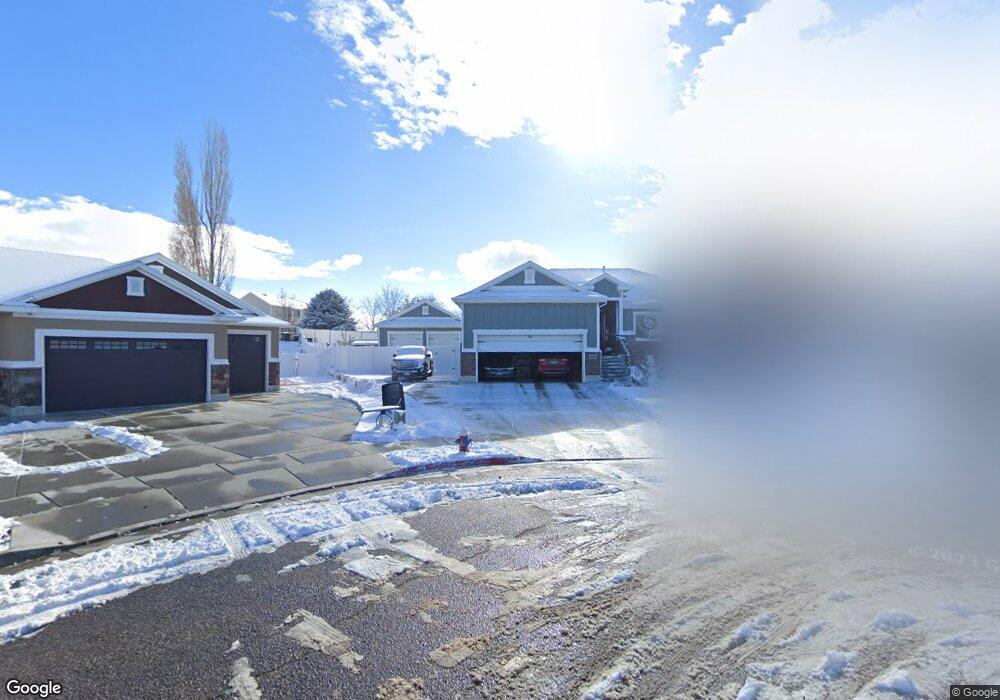
This home is located at 4048 S 2225 W Unit 77, Roy, UT 84067 and is currently estimated at $622,412, approximately $375 per square foot. 4048 S 2225 W Unit 77 is a home located in Weber County with nearby schools including North Park School, Sand Ridge Junior High School, and Roy High School.
Ownership History
Date
Name
Owned For
Owner Type
Purchase Details
Closed on
Apr 6, 2017
Sold by
American Legacy Homes Inc
Bought by
Beyer Christopher A and Beyer Melissa M
Current Estimated Value
Home Financials for this Owner
Home Financials are based on the most recent Mortgage that was taken out on this home.
Original Mortgage
$241,000
Outstanding Balance
$141,734
Interest Rate
4.1%
Mortgage Type
Credit Line Revolving
Estimated Equity
$480,678
Purchase Details
Closed on
Sep 28, 2016
Sold by
Stephens Gene
Bought by
Roy City
Purchase Details
Closed on
Jul 7, 2016
Sold by
Stephens Properties Llc
Bought by
American Legacy Homes Inc
Home Financials for this Owner
Home Financials are based on the most recent Mortgage that was taken out on this home.
Original Mortgage
$230,000
Interest Rate
3.64%
Mortgage Type
Future Advance Clause Open End Mortgage
Purchase Details
Closed on
Dec 8, 2005
Sold by
Regency Development Lc
Bought by
Pilkington Paul A and Pilkington Darby J
Create a Home Valuation Report for This Property
The Home Valuation Report is an in-depth analysis detailing your home's value as well as a comparison with similar homes in the area
Home Values in the Area
Average Home Value in this Area
Purchase History
| Date | Buyer | Sale Price | Title Company |
|---|---|---|---|
| Beyer Christopher A | -- | Stewart Title Insurance Co | |
| Roy City | -- | None Available | |
| American Legacy Homes Inc | -- | Stewart Title Ins Agency | |
| Pilkington Paul A | -- | Mountain View Title Ogden |
Source: Public Records
Mortgage History
| Date | Status | Borrower | Loan Amount |
|---|---|---|---|
| Open | Beyer Christopher A | $241,000 | |
| Previous Owner | American Legacy Homes Inc | $230,000 |
Source: Public Records
Tax History
| Year | Tax Paid | Tax Assessment Tax Assessment Total Assessment is a certain percentage of the fair market value that is determined by local assessors to be the total taxable value of land and additions on the property. | Land | Improvement |
|---|---|---|---|---|
| 2025 | $3,273 | $623,068 | $169,246 | $453,822 |
| 2024 | $3,199 | $336,598 | $93,085 | $243,513 |
| 2023 | $3,285 | $343,750 | $91,704 | $252,046 |
| 2022 | $3,637 | $366,850 | $74,523 | $292,327 |
| 2021 | $3,106 | $477,000 | $88,990 | $388,010 |
| 2020 | $2,745 | $385,000 | $88,990 | $296,010 |
| 2019 | $2,740 | $363,000 | $68,098 | $294,902 |
| 2018 | $2,855 | $359,001 | $68,098 | $290,903 |
| 2017 | $1,554 | $172,729 | $67,097 | $105,632 |
| 2016 | $903 | $61,984 | $61,984 | $0 |
| 2015 | $876 | $61,984 | $61,984 | $0 |
| 2014 | $771 | $53,955 | $53,955 | $0 |
Source: Public Records
Map
Nearby Homes
- 4061 S 2175 W
- 4047 S 2175 W
- 4220 S 2075 W
- 2240 W 3875 S
- 1959 3985 St S Unit 2
- 3923 S 1975 W Unit 15
- 2015 W 4225 S
- 4328 S 2175 W
- 4248 S 2400 W
- 3860 Midland Dr Unit C10
- 3860 Midland Dr Unit C39
- 3860 Midland Dr Unit A18
- 3860 Midland Dr Unit B32
- 3860 Midland Dr Unit C62
- 1910 W 3920 S
- 2602 W 3900 S
- 3705 S 2025 W
- 3750 Midland Dr
- 3750 Midland Dr Unit 169
- 3800 S 1900 W Unit 113
- 4048 S 2225 W
- 4036 S 2225 W
- 4036 S 2225 W Unit 76
- 4074 S 2225 W
- 4049 S 2225 W
- 4073 S 2225 W
- 4024 S 2225 W
- 4024 S 2225 W Unit 75
- 4055 S 2175 W
- 4035 S 2225 W
- 4035 S 2225 W Unit 79
- 4089 S 2225 W
- 4090 S 2225 W
- 4091 S 2225 W
- 4023 S 2225 W
- 4012 S 2225 W Unit 74
- 4096 S 2275 W
- 4037 S 2175 W
- 4104 S 2225 W
- 4105 S 2225 W
Your Personal Tour Guide
Ask me questions while you tour the home.