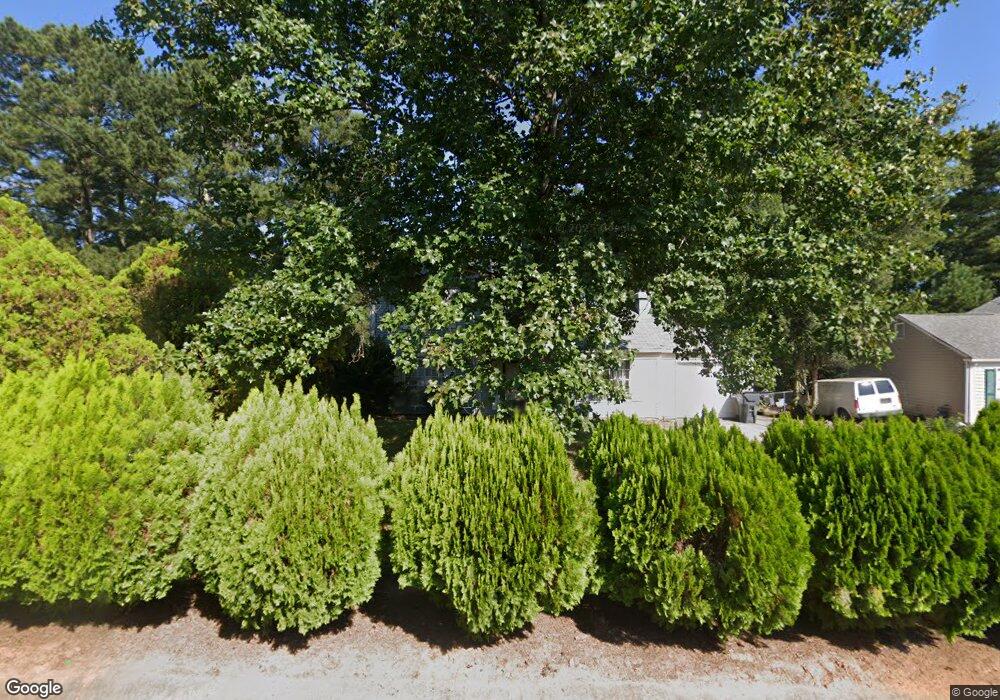
4049 Anvil Ct Unit II Norcross, GA 30093
Estimated Value: $302,000 - $372,000
3
Beds
3
Baths
1,524
Sq Ft
$222/Sq Ft
Est. Value
About This Home
This home is located at 4049 Anvil Ct Unit II, Norcross, GA 30093 and is currently estimated at $337,767, approximately $221 per square foot. 4049 Anvil Ct Unit II is a home located in Gwinnett County with nearby schools including Ferguson Elementary School, Louise Radloff Middle School, and Meadowcreek High School.
Ownership History
Date
Name
Owned For
Owner Type
Purchase Details
Closed on
Jun 6, 2001
Sold by
Lloyd Trina M
Bought by
Lloyd Kilvin L
Current Estimated Value
Purchase Details
Closed on
May 10, 1999
Sold by
Breen Linda
Bought by
Breen Linda and Breen Andrea H
Home Financials for this Owner
Home Financials are based on the most recent Mortgage that was taken out on this home.
Original Mortgage
$103,100
Interest Rate
6.98%
Mortgage Type
FHA
Purchase Details
Closed on
Apr 27, 1999
Sold by
Shah Rajendrakumar K and Shah Daksha
Bought by
Lloyd Kilvin L and Lloyd Trina M
Home Financials for this Owner
Home Financials are based on the most recent Mortgage that was taken out on this home.
Original Mortgage
$103,100
Interest Rate
6.98%
Mortgage Type
FHA
Create a Home Valuation Report for This Property
The Home Valuation Report is an in-depth analysis detailing your home's value as well as a comparison with similar homes in the area
Home Values in the Area
Average Home Value in this Area
Purchase History
| Date | Buyer | Sale Price | Title Company |
|---|---|---|---|
| Lloyd Kilvin L | -- | -- | |
| Breen Linda | -- | -- | |
| Lloyd Kilvin L | $104,000 | -- |
Source: Public Records
Mortgage History
| Date | Status | Borrower | Loan Amount |
|---|---|---|---|
| Previous Owner | Breen Linda | $103,100 | |
| Previous Owner | Lloyd Kilvin L | $103,100 |
Source: Public Records
Tax History Compared to Growth
Tax History
| Year | Tax Paid | Tax Assessment Tax Assessment Total Assessment is a certain percentage of the fair market value that is determined by local assessors to be the total taxable value of land and additions on the property. | Land | Improvement |
|---|---|---|---|---|
| 2024 | $4,517 | $117,160 | $21,120 | $96,040 |
| 2023 | $4,517 | $109,320 | $22,000 | $87,320 |
| 2022 | $3,720 | $95,920 | $20,000 | $75,920 |
| 2021 | $2,881 | $71,360 | $14,240 | $57,120 |
| 2020 | $2,896 | $71,360 | $14,240 | $57,120 |
| 2019 | $2,792 | $71,360 | $14,240 | $57,120 |
| 2018 | $2,447 | $61,560 | $12,000 | $49,560 |
| 2016 | $1,690 | $39,440 | $8,400 | $31,040 |
| 2015 | $1,707 | $39,440 | $8,400 | $31,040 |
| 2014 | -- | $39,440 | $8,400 | $31,040 |
Source: Public Records
Map
Nearby Homes
- 4092 Anvil Ct Unit 2
- 1432 Shenta Oak Dr
- 1331 Sweet Pine Dr
- 3975 Creek Water Ct Unit 1
- 3955 Peninsula Ct
- 4139 Magnolia Glen Walk
- 4059 Heritage Valley Ct
- 3974 Stillwater Dr
- 4017 Heritage Valley Ct
- 4042 Stillwater Dr Unit 4042
- 4096 Stillwater Dr Unit 4096
- 1146 Samuel Dr
- 4173 Stillwater Dr
- 3959 Stillwater Dr
- 4183 Stillwater Dr
- 4089 Stillwater Dr
- 4118 Stillwater Dr Unit 4118
- 4023 Stillwater Dr
- 1151 Overland Hill Trace
- 1455 Woodington Cir
- 4055 Anvil Ct
- 4043 Anvil Ct
- 1621 Black Hickory Place Unit II
- 1631 Black Hickory Place
- 4061 Anvil Ct
- 4037 Anvil Ct
- 1611 Black Hickory Place
- 4044 Anvil Ct
- 0 Anvil Ct Unit 7548338
- 0 Anvil Ct Unit 7156653
- 0 Anvil Ct Unit 3194916
- 0 Anvil Ct
- 4038 Anvil Ct
- 4050 Anvil Ct
- 1601 Black Hickory Place
- 1677 Black Hickory Place
- 1641 Black Hickory Place
- 4067 Anvil Ct Unit II
- 4032 Anvil Ct
- 4031 Anvil Ct