Estimated Value: $481,000 - $550,000
3
Beds
3
Baths
2,199
Sq Ft
$229/Sq Ft
Est. Value
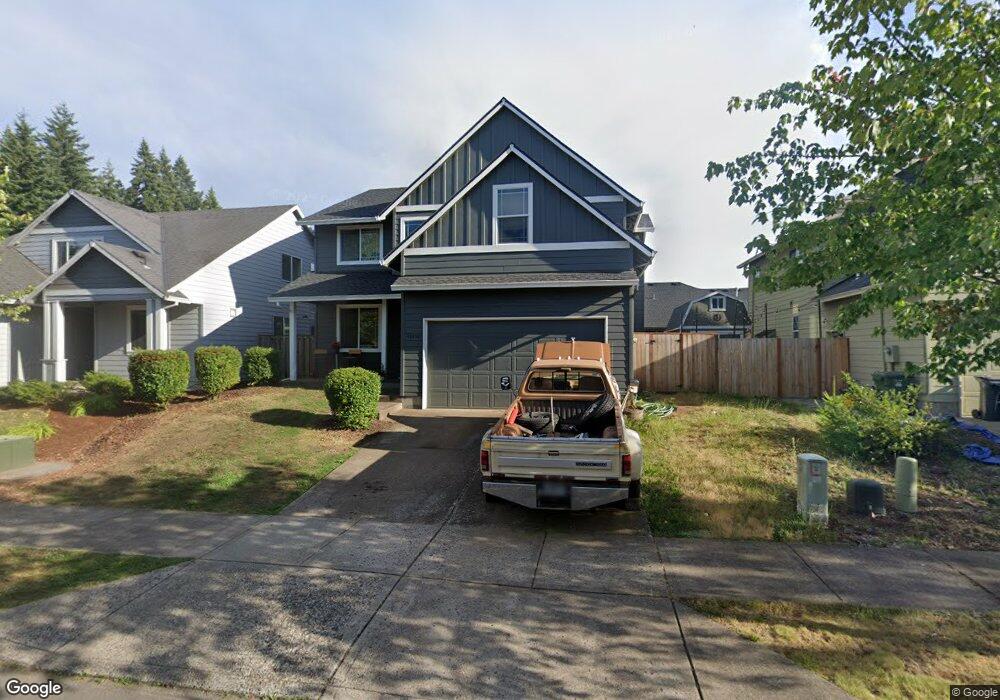
About This Home
This home is located at 40490 Fawn St, Sandy, OR 97055 and is currently estimated at $504,493, approximately $229 per square foot. 40490 Fawn St is a home located in Clackamas County with nearby schools including Firwood Elementary School, Cedar Ridge Middle School, and Sandy High School.
Ownership History
Date
Name
Owned For
Owner Type
Purchase Details
Closed on
Jan 10, 2019
Sold by
Trenda Olmar
Bought by
Olmos Ramos Martin E
Current Estimated Value
Purchase Details
Closed on
Mar 28, 2016
Sold by
Robinson Matthew
Bought by
Olmos Ramos Martin E and Olmos Trenda
Home Financials for this Owner
Home Financials are based on the most recent Mortgage that was taken out on this home.
Original Mortgage
$303,403
Interest Rate
3.5%
Mortgage Type
FHA
Purchase Details
Closed on
Sep 20, 2013
Sold by
Mountain Lake Homes Inc
Bought by
Robinson Matthew
Purchase Details
Closed on
Feb 21, 2007
Sold by
Sun Ridge Construction Inc
Bought by
Mountain Lake Homes Inc
Home Financials for this Owner
Home Financials are based on the most recent Mortgage that was taken out on this home.
Original Mortgage
$240,000
Interest Rate
6.21%
Mortgage Type
Seller Take Back
Create a Home Valuation Report for This Property
The Home Valuation Report is an in-depth analysis detailing your home's value as well as a comparison with similar homes in the area
Home Values in the Area
Average Home Value in this Area
Purchase History
| Date | Buyer | Sale Price | Title Company |
|---|---|---|---|
| Olmos Ramos Martin E | $309,000 | None Available | |
| Olmos Ramos Martin E | $309,000 | First American | |
| Robinson Matthew | $249,950 | Wfg Title Inc | |
| Mountain Lake Homes Inc | $94,000 | Accommodation |
Source: Public Records
Mortgage History
| Date | Status | Borrower | Loan Amount |
|---|---|---|---|
| Previous Owner | Olmos Ramos Martin E | $303,403 | |
| Previous Owner | Mountain Lake Homes Inc | $240,000 |
Source: Public Records
Tax History
| Year | Tax Paid | Tax Assessment Tax Assessment Total Assessment is a certain percentage of the fair market value that is determined by local assessors to be the total taxable value of land and additions on the property. | Land | Improvement |
|---|---|---|---|---|
| 2025 | $4,723 | $275,275 | -- | -- |
| 2024 | $4,524 | $267,258 | -- | -- |
| 2023 | $4,524 | $259,474 | $0 | $0 |
| 2022 | $4,285 | $251,917 | $0 | $0 |
| 2021 | $4,138 | $244,580 | $0 | $0 |
| 2020 | $4,026 | $237,457 | $0 | $0 |
| 2019 | $3,987 | $230,541 | $0 | $0 |
| 2018 | $3,876 | $223,826 | $0 | $0 |
| 2017 | $3,782 | $217,307 | $0 | $0 |
| 2016 | $3,652 | $210,978 | $0 | $0 |
Source: Public Records
Map
Nearby Homes
- 18462 SE Langensand Rd
- 18050 SE Langensand Rd
- 40192 Laurel St
- 41057 SE Vista Loop Dr
- 41081 SE Vista Loop Dr
- 39784 Syblon Ln
- 41375 SE Vista Loop Dr
- 18635 Warm Springs St Unit 4
- 18712 Cloud Cap Ave
- 39576 Trillium St
- 18605 Warm Springs St
- 0 SE Coalman Rd
- 41540 Metolius Ave Unit 19
- 41570 Metolius Ave Unit 22
- 41580 Metolius Ave Unit 23
- 39329 Woodbury Way
- 39307 Woodbury Way
- 18865 Crooked River St Unit 42
- 18845 Crooked River St Unit 40
- 0 SE Jacoby Rd Unit 800
- 40492 Fawn St
- 40488 Fawn St
- 18342 Antler Ave
- 40494 Fawn St
- 18351 Meadow Ave
- 18346 Antler Ave
- 40491 Fawn St
- 18357 Meadow Ave
- 40493 Fawn St
- 40489 Fawn St
- 40379 Therese St
- 18348 Antler Ave
- 40495 Fawn St
- 18331 Antler Ave
- 18371 Meadow Ave
- 18329 Antler Ave
- 40496 Fawn St
- 40371 Therese St
- 18327 Antler Ave
- 18402 Antler Ave
Your Personal Tour Guide
Ask me questions while you tour the home.