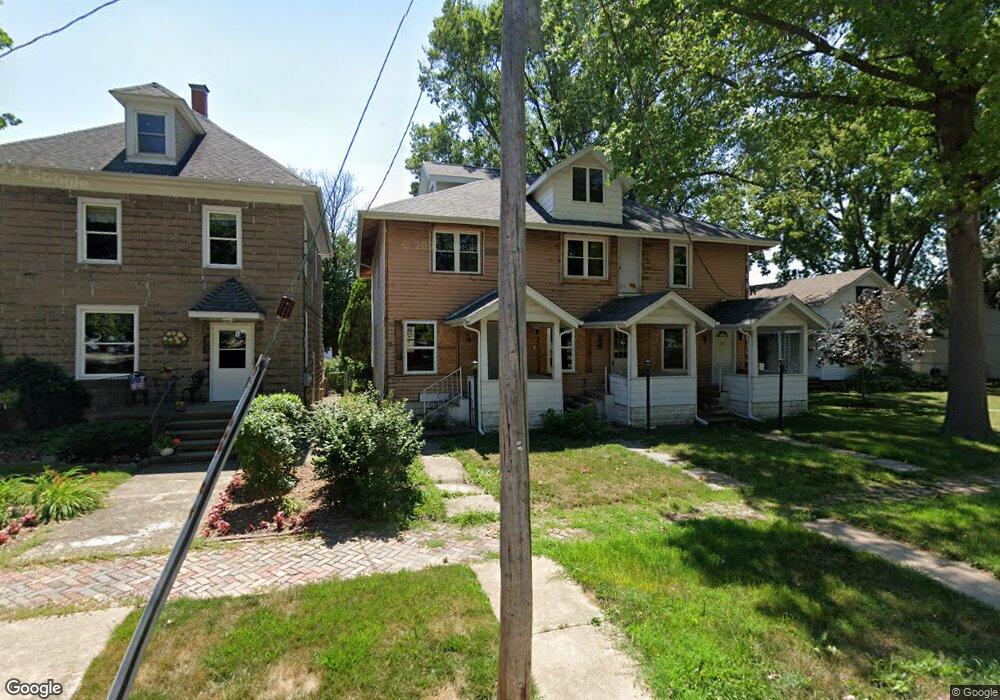
405 16th Ave Sterling, IL 61081
Estimated Value: $71,259 - $99,000
7
Beds
7
Baths
3,064
Sq Ft
$28/Sq Ft
Est. Value
About This Home
This home is located at 405 16th Ave, Sterling, IL 61081 and is currently estimated at $87,065, approximately $28 per square foot. 405 16th Ave is a home located in Whiteside County with nearby schools including Christ Lutheran School.
Ownership History
Date
Name
Owned For
Owner Type
Purchase Details
Closed on
Jul 29, 2022
Sold by
Sterling Industrial Development Commissi
Bought by
Fth Holdings Llc
Current Estimated Value
Purchase Details
Closed on
Mar 1, 2006
Sold by
Mancera Sybil J
Bought by
Oleson Daniel E and Oleson Dustin E
Home Financials for this Owner
Home Financials are based on the most recent Mortgage that was taken out on this home.
Original Mortgage
$117,038
Interest Rate
6.2%
Mortgage Type
Future Advance Clause Open End Mortgage
Create a Home Valuation Report for This Property
The Home Valuation Report is an in-depth analysis detailing your home's value as well as a comparison with similar homes in the area
Home Values in the Area
Average Home Value in this Area
Purchase History
| Date | Buyer | Sale Price | Title Company |
|---|---|---|---|
| Fth Holdings Llc | -- | Ward Murray Pace & Johnson Pc | |
| Oleson Daniel E | $120,000 | None Available |
Source: Public Records
Mortgage History
| Date | Status | Borrower | Loan Amount |
|---|---|---|---|
| Previous Owner | Oleson Daniel E | $117,038 |
Source: Public Records
Tax History Compared to Growth
Tax History
| Year | Tax Paid | Tax Assessment Tax Assessment Total Assessment is a certain percentage of the fair market value that is determined by local assessors to be the total taxable value of land and additions on the property. | Land | Improvement |
|---|---|---|---|---|
| 2024 | $1,065 | $10,212 | $3,482 | $6,730 |
| 2023 | $1,005 | $9,586 | $3,269 | $6,317 |
| 2022 | $411 | $3,845 | $1,311 | $2,534 |
| 2021 | $377 | $0 | $0 | $0 |
| 2020 | $377 | $0 | $0 | $0 |
| 2019 | $914 | $8,195 | $2,795 | $5,400 |
| 2018 | $3,286 | $29,844 | $2,799 | $27,045 |
| 2017 | $3,293 | $29,640 | $2,780 | $26,860 |
| 2016 | $3,209 | $28,684 | $2,690 | $25,994 |
| 2015 | $3,068 | $29,472 | $2,764 | $26,708 |
| 2014 | $3,062 | $28,818 | $2,703 | $26,115 |
| 2013 | $3,068 | $29,472 | $2,764 | $26,708 |
Source: Public Records
Map
Nearby Homes