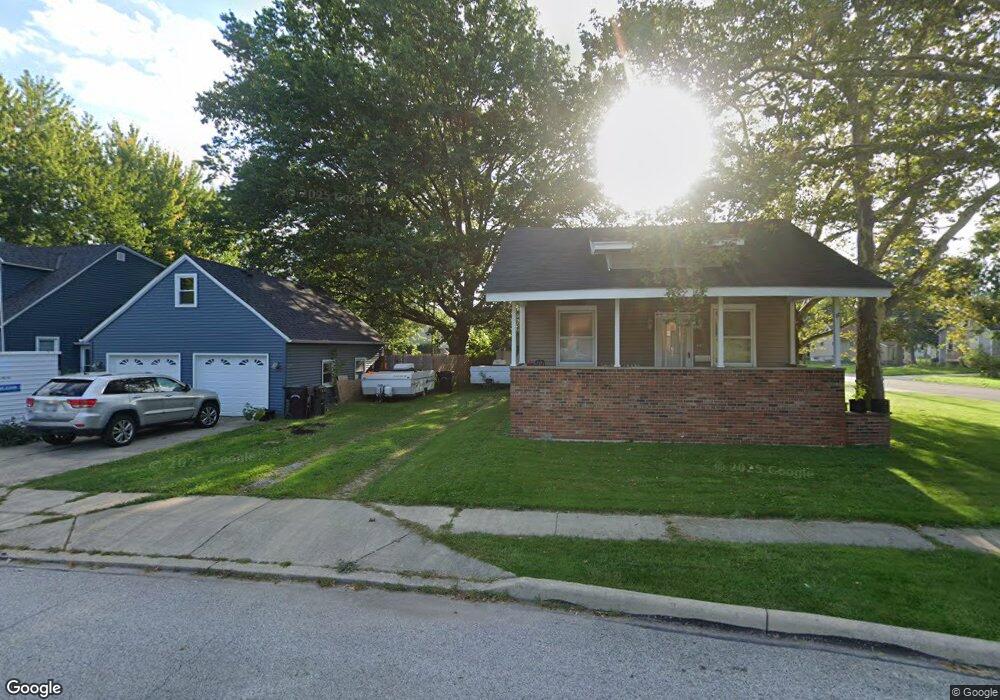
405 Abbe Rd N Elyria, OH 44035
Estimated Value: $393,712
Studio
--
Bath
20,000
Sq Ft
$20/Sq Ft
Est. Value
About This Home
This home is located at 405 Abbe Rd N, Elyria, OH 44035 and is currently estimated at $393,712, approximately $19 per square foot. 405 Abbe Rd N is a home located in Lorain County with nearby schools including Eastern Heights Middle School, Elyria High School, and Lake Ridge Academy.
Ownership History
Date
Name
Owned For
Owner Type
Purchase Details
Closed on
Dec 16, 2019
Sold by
Grafton Development Llc
Bought by
169 Reaser Court Llc
Current Estimated Value
Purchase Details
Closed on
Dec 18, 2010
Sold by
Ke & G Enterprises Llc
Bought by
Grafton Development Llc
Home Financials for this Owner
Home Financials are based on the most recent Mortgage that was taken out on this home.
Original Mortgage
$200,000
Interest Rate
4.16%
Mortgage Type
Future Advance Clause Open End Mortgage
Purchase Details
Closed on
Oct 16, 2010
Sold by
Ke & G Enterprises Llc
Bought by
Ke & G Enterprises Llc
Create a Home Valuation Report for This Property
The Home Valuation Report is an in-depth analysis detailing your home's value as well as a comparison with similar homes in the area
Home Values in the Area
Average Home Value in this Area
Purchase History
| Date | Buyer | Sale Price | Title Company |
|---|---|---|---|
| 169 Reaser Court Llc | $218,100 | Guardian Title | |
| Grafton Development Llc | -- | Examco Title Services | |
| Ke & G Enterprises Llc | -- | Attorney |
Source: Public Records
Mortgage History
| Date | Status | Borrower | Loan Amount |
|---|---|---|---|
| Previous Owner | Grafton Development Llc | $200,000 |
Source: Public Records
Tax History
| Year | Tax Paid | Tax Assessment Tax Assessment Total Assessment is a certain percentage of the fair market value that is determined by local assessors to be the total taxable value of land and additions on the property. | Land | Improvement |
|---|---|---|---|---|
| 2024 | $8,914 | $148,320 | $36,922 | $111,398 |
| 2023 | $8,526 | $117,285 | $36,922 | $80,364 |
| 2022 | $8,481 | $117,285 | $36,922 | $80,364 |
| 2021 | $8,555 | $117,285 | $36,922 | $80,364 |
| 2020 | $8,894 | $117,280 | $36,920 | $80,360 |
| 2019 | $8,805 | $117,280 | $36,920 | $80,360 |
| 2018 | $8,077 | $117,280 | $36,920 | $80,360 |
| 2017 | $7,444 | $94,170 | $36,920 | $57,250 |
| 2016 | $7,332 | $94,170 | $36,920 | $57,250 |
| 2015 | $6,905 | $94,170 | $36,920 | $57,250 |
| 2014 | $6,808 | $94,170 | $36,920 | $57,250 |
| 2013 | $6,691 | $94,170 | $36,920 | $57,250 |
Source: Public Records
Map
Nearby Homes
- 350 Concord Ave
- 164 Woodbury St
- 340 Boston Ave
- 147 Bellfield Ave
- 154 Bellfield Ave
- 539 Princeton Ave
- 232 Hawthorne St
- 144 Roosevelt Ave
- 800 Boston Ave
- 129 Brandtson Ave
- 123 Harwood St
- 828 S Logan St
- 832 S Logan St
- 209 Clark St
- 347 Kenyon Ave
- 297 Abbe Rd N
- 249 Roosevelt Ave
- 335 Abbe Rd N
- 331 Abbe Rd N
- 560 Case Ave
Your Personal Tour Guide
Ask me questions while you tour the home.