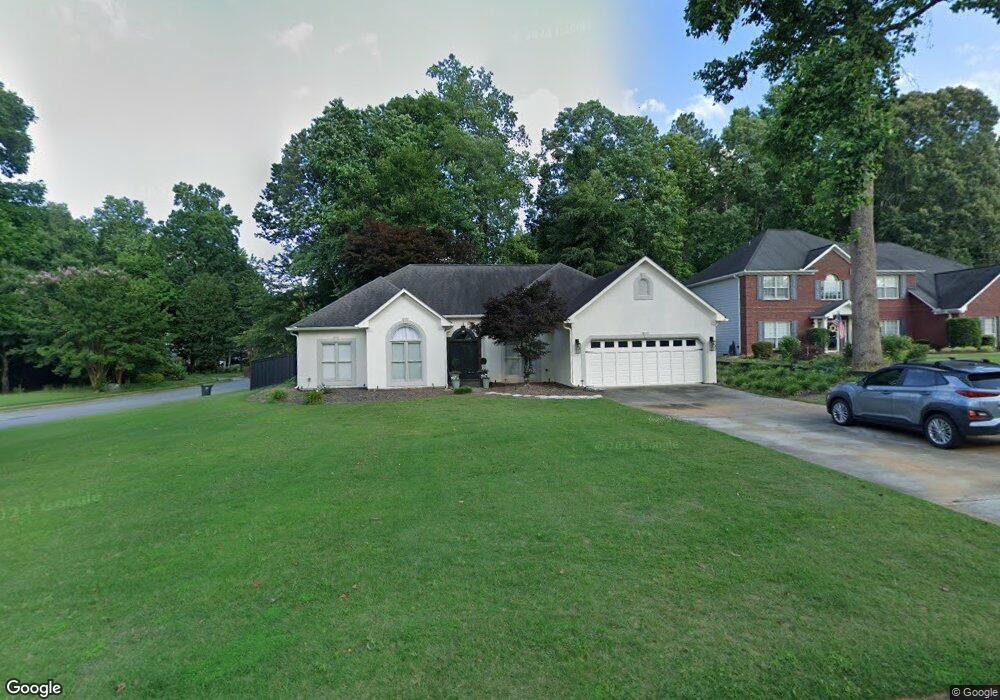
405 Allenbrook Ct Roswell, GA 30075
Estimated Value: $669,124 - $762,000
4
Beds
3
Baths
2,745
Sq Ft
$262/Sq Ft
Est. Value
About This Home
This home is located at 405 Allenbrook Ct, Roswell, GA 30075 and is currently estimated at $720,531, approximately $262 per square foot. 405 Allenbrook Ct is a home located in Fulton County with nearby schools including Roswell North Elementary School, Crabapple Middle School, and Fellowship Christian School.
Ownership History
Date
Name
Owned For
Owner Type
Purchase Details
Closed on
Jul 12, 2018
Sold by
Cook John E
Bought by
Cusick Allison A
Current Estimated Value
Purchase Details
Closed on
Nov 30, 2005
Sold by
Moritz Mark
Bought by
Cook John E
Home Financials for this Owner
Home Financials are based on the most recent Mortgage that was taken out on this home.
Original Mortgage
$202,500
Interest Rate
6.29%
Mortgage Type
New Conventional
Purchase Details
Closed on
Aug 28, 2002
Sold by
Eberhardt Mary L
Bought by
Moritz Mark
Home Financials for this Owner
Home Financials are based on the most recent Mortgage that was taken out on this home.
Original Mortgage
$188,400
Interest Rate
6.18%
Mortgage Type
New Conventional
Purchase Details
Closed on
Oct 31, 1994
Sold by
Ultima Highlands Ltd
Bought by
Eberhardt Mary L
Home Financials for this Owner
Home Financials are based on the most recent Mortgage that was taken out on this home.
Original Mortgage
$134,400
Interest Rate
8.78%
Create a Home Valuation Report for This Property
The Home Valuation Report is an in-depth analysis detailing your home's value as well as a comparison with similar homes in the area
Home Values in the Area
Average Home Value in this Area
Purchase History
| Date | Buyer | Sale Price | Title Company |
|---|---|---|---|
| Cusick Allison A | $371,203 | -- | |
| Cook John E | $270,000 | -- | |
| Moritz Mark | $235,500 | -- | |
| Eberhardt Mary L | $168,000 | -- |
Source: Public Records
Mortgage History
| Date | Status | Borrower | Loan Amount |
|---|---|---|---|
| Previous Owner | Cook John E | $202,500 | |
| Previous Owner | Moritz Mark | $188,400 | |
| Previous Owner | Eberhardt Mary L | $134,400 |
Source: Public Records
Tax History Compared to Growth
Tax History
| Year | Tax Paid | Tax Assessment Tax Assessment Total Assessment is a certain percentage of the fair market value that is determined by local assessors to be the total taxable value of land and additions on the property. | Land | Improvement |
|---|---|---|---|---|
| 2025 | $863 | $229,480 | $58,960 | $170,520 |
| 2023 | $5,880 | $208,320 | $65,320 | $143,000 |
| 2022 | $3,687 | $179,040 | $42,560 | $136,480 |
| 2021 | $4,159 | $140,480 | $20,200 | $120,280 |
| 2020 | $4,427 | $147,840 | $20,160 | $127,680 |
| 2019 | $719 | $145,200 | $19,800 | $125,400 |
| 2018 | $3,932 | $139,320 | $19,320 | $120,000 |
| 2017 | $3,458 | $118,520 | $25,240 | $93,280 |
| 2016 | $3,459 | $118,520 | $25,240 | $93,280 |
| 2015 | $4,119 | $118,520 | $25,240 | $93,280 |
| 2014 | $2,999 | $97,840 | $20,840 | $77,000 |
Source: Public Records
Map
Nearby Homes
- 10908 Woodstock Rd
- 210 Devereux Downs
- 5000 Lexington Dr
- 130 Elizabeth Cove
- 1002 Towneship Way
- 1000 Sterling Ct
- 1012 Towneship Way
- 515 Wavetree Dr
- 115 Great Oaks Ln
- 110 Great Oaks Ln
- 6010 Claiborne Cove
- 178 Victoria Way
- 5022 Towneship Creek Rd
- 120 Gala Ct
- 310 Bloomfield Ct
- 220 Wind Shadow Ct
- 1515 Elgaen Place Dr
- 10875 Shallowford Rd
- 415 Allenbrook Ct Unit 27
- 415 Allenbrook Ct
- 1005 Allenbrook Ln
- 990 Allenbrook Ln
- 400 Allenbrook Ct
- 1000 Allenbrook Ln
- 425 Allenbrook Ct
- 980 Allenbrook Ln
- 410 Allenbrook Ct
- 1015 Allenbrook Ln
- 970 Allenbrook Ln
- 435 Allenbrook Ct
- 1025 Allenbrook Ln
- 960 Allenbrook Ln
- 1020 Allenbrook Ln
- 1020 Allenbrook Ln
- 925 Allenbrook Ln
- 420 Allenbrook Ct
- 11130 Crosshaven Dr
- 11140 Crosshaven Dr