Estimated Value: $367,000 - $442,000
3
Beds
2
Baths
2,158
Sq Ft
$184/Sq Ft
Est. Value
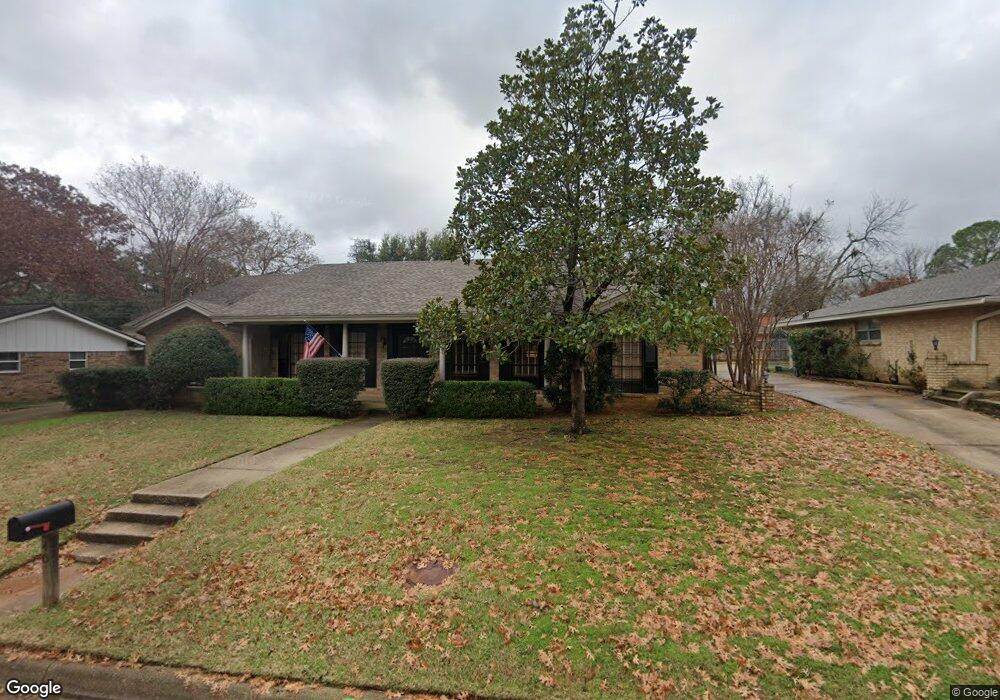
About This Home
This home is located at 405 Baker Dr, Hurst, TX 76054 and is currently estimated at $397,322, approximately $184 per square foot. 405 Baker Dr is a home located in Tarrant County with nearby schools including Shady Oaks Elementary School, Bedford Junior High School, and L.D. Bell High School.
Ownership History
Date
Name
Owned For
Owner Type
Purchase Details
Closed on
Jun 29, 2001
Sold by
Romano Leonard S and Romano Jami
Bought by
Bates Kenneth
Current Estimated Value
Home Financials for this Owner
Home Financials are based on the most recent Mortgage that was taken out on this home.
Original Mortgage
$145,713
Outstanding Balance
$56,399
Interest Rate
7.2%
Mortgage Type
FHA
Estimated Equity
$340,923
Purchase Details
Closed on
Mar 17, 1998
Sold by
Romano Leonard S
Bought by
Romano Leonar S and Romano Jami
Purchase Details
Closed on
Sep 3, 1997
Sold by
Hatfield James S and Hatfield Ruth E
Bought by
Romano Leonard S
Home Financials for this Owner
Home Financials are based on the most recent Mortgage that was taken out on this home.
Original Mortgage
$78,375
Interest Rate
7.43%
Create a Home Valuation Report for This Property
The Home Valuation Report is an in-depth analysis detailing your home's value as well as a comparison with similar homes in the area
Home Values in the Area
Average Home Value in this Area
Purchase History
| Date | Buyer | Sale Price | Title Company |
|---|---|---|---|
| Bates Kenneth | -- | American Title Co | |
| Romano Leonar S | -- | -- | |
| Romano Leonard S | -- | Safeco Land Title |
Source: Public Records
Mortgage History
| Date | Status | Borrower | Loan Amount |
|---|---|---|---|
| Open | Bates Kenneth | $145,713 | |
| Previous Owner | Romano Leonard S | $78,375 | |
| Closed | Romano Leonar S | $0 |
Source: Public Records
Tax History
| Year | Tax Paid | Tax Assessment Tax Assessment Total Assessment is a certain percentage of the fair market value that is determined by local assessors to be the total taxable value of land and additions on the property. | Land | Improvement |
|---|---|---|---|---|
| 2025 | $4,249 | $284,948 | $80,000 | $204,948 |
| 2024 | $4,249 | $284,948 | $80,000 | $204,948 |
| 2023 | $5,372 | $291,911 | $55,000 | $236,911 |
| 2022 | $5,612 | $243,758 | $55,000 | $188,758 |
| 2021 | $5,444 | $225,734 | $55,000 | $170,734 |
| 2020 | $5,831 | $256,056 | $55,000 | $201,056 |
| 2019 | $5,393 | $263,601 | $55,000 | $208,601 |
| 2018 | $4,288 | $200,316 | $55,000 | $145,316 |
| 2017 | $4,608 | $212,098 | $40,000 | $172,098 |
| 2016 | $4,189 | $182,475 | $40,000 | $142,475 |
| 2015 | $3,489 | $150,500 | $17,000 | $133,500 |
| 2014 | $3,489 | $150,500 | $17,000 | $133,500 |
Source: Public Records
Map
Nearby Homes
- 413 Baker Dr
- 409 Circleview Dr N
- 440 W Louella Dr
- 520 Baker Dr
- 600 Circleview Dr N
- 604 Baker Dr
- 417 Shade Tree Cir
- 612 Circleview Dr S
- 532 Plainview Dr
- 1917 Hurstview Dr
- 224 Plainview Dr
- 200 Hillview Dr
- 1616 Oak Creek Dr
- 1428 Pamela St
- 421 Cavender Ct
- 2021 Mountainview Dr
- 416 Cavender Ct
- 1625 Oak Creek Dr
- 129 E Louella Dr
- 716 Thousand Oaks Dr
- 401 Baker Dr
- 409 Baker Dr
- 404 Circleview Dr N
- 408 Circleview Dr N
- 400 Circleview Dr N
- 404 Baker Dr
- 400 Baker Dr
- 408 Baker Dr
- 412 Circleview Dr N
- 345 Baker Dr
- 412 Baker Dr
- 417 Baker Dr
- 344 Circleview Dr N
- 344 Baker Dr
- 416 Circleview Dr N
- 405 W Louella Dr
- 405 Circleview Dr N
- 401 W Louella Dr
- 409 W Louella Dr
- 416 Baker Dr
Your Personal Tour Guide
Ask me questions while you tour the home.