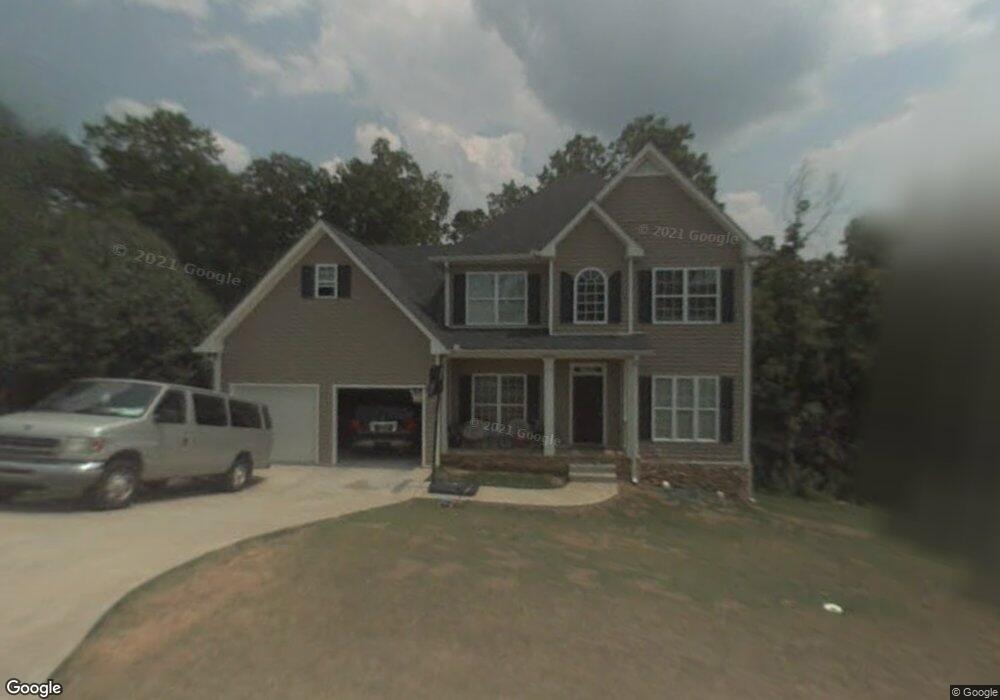
405 Ballymore Pass Unit 753 Woodstock, GA 30189
Sutallee NeighborhoodEstimated Value: $493,206 - $504,000
5
Beds
3
Baths
2,428
Sq Ft
$205/Sq Ft
Est. Value
About This Home
This home is located at 405 Ballymore Pass Unit 753, Woodstock, GA 30189 and is currently estimated at $498,603, approximately $205 per square foot. 405 Ballymore Pass Unit 753 is a home located in Cherokee County with nearby schools including Boston Elementary School, E. T. Booth Middle School, and Etowah High School.
Ownership History
Date
Name
Owned For
Owner Type
Purchase Details
Closed on
May 23, 2025
Sold by
Knapp Lisa
Bought by
Kalina Steven L
Current Estimated Value
Home Financials for this Owner
Home Financials are based on the most recent Mortgage that was taken out on this home.
Original Mortgage
$441,000
Outstanding Balance
$438,716
Interest Rate
6.81%
Mortgage Type
New Conventional
Estimated Equity
$59,887
Purchase Details
Closed on
May 12, 2025
Sold by
Wenke Daniel D
Bought by
Knapp Lisa Lorraine
Home Financials for this Owner
Home Financials are based on the most recent Mortgage that was taken out on this home.
Original Mortgage
$441,000
Outstanding Balance
$438,716
Interest Rate
6.81%
Mortgage Type
New Conventional
Estimated Equity
$59,887
Purchase Details
Closed on
Mar 6, 2020
Sold by
Ah4r Properties Llc
Bought by
Knapp Lisa
Purchase Details
Closed on
Sep 14, 2012
Sold by
Dobson Properties Inc
Bought by
Ah4r I Ga Llc
Purchase Details
Closed on
Aug 4, 2009
Sold by
Burns Harry H
Bought by
Dobson Properties Inc
Purchase Details
Closed on
May 6, 2005
Sold by
Metro Financial & Dev Llc
Bought by
Burns Harry H
Home Financials for this Owner
Home Financials are based on the most recent Mortgage that was taken out on this home.
Original Mortgage
$207,000
Interest Rate
7.45%
Purchase Details
Closed on
Nov 14, 2003
Sold by
Mv Enterprises Inc
Bought by
Metro Finl & Development Llc
Home Financials for this Owner
Home Financials are based on the most recent Mortgage that was taken out on this home.
Original Mortgage
$161,500
Interest Rate
5.85%
Create a Home Valuation Report for This Property
The Home Valuation Report is an in-depth analysis detailing your home's value as well as a comparison with similar homes in the area
Home Values in the Area
Average Home Value in this Area
Purchase History
| Date | Buyer | Sale Price | Title Company |
|---|---|---|---|
| Kalina Steven L | $490,000 | -- | |
| Knapp Lisa Lorraine | -- | -- | |
| Knapp Lisa | $245,500 | -- | |
| Ah4r I Ga Llc | $179,100 | -- | |
| Dobson Properties Inc | $118,000 | -- | |
| Burns Harry H | -- | -- | |
| Metro Finl & Development Llc | $42,500 | -- |
Source: Public Records
Mortgage History
| Date | Status | Borrower | Loan Amount |
|---|---|---|---|
| Open | Knapp Lisa Lorraine | $441,000 | |
| Previous Owner | Burns Harry H | $207,000 | |
| Previous Owner | Metro Finl & Development Llc | $161,500 |
Source: Public Records
Tax History Compared to Growth
Tax History
| Year | Tax Paid | Tax Assessment Tax Assessment Total Assessment is a certain percentage of the fair market value that is determined by local assessors to be the total taxable value of land and additions on the property. | Land | Improvement |
|---|---|---|---|---|
| 2025 | $1,012 | $185,920 | $34,000 | $151,920 |
| 2024 | $926 | $139,240 | $31,529 | $107,711 |
| 2023 | $787 | $139,240 | $31,529 | $107,711 |
| 2022 | $3,476 | $141,320 | $32,000 | $109,320 |
| 2021 | $2,725 | $98,200 | $17,748 | $80,452 |
| 2020 | $2,989 | $105,200 | $19,017 | $86,183 |
| 2019 | $3,144 | $110,640 | $20,000 | $90,640 |
| 2018 | $3,013 | $105,400 | $18,000 | $87,400 |
| 2017 | $2,648 | $225,300 | $14,000 | $76,120 |
| 2016 | $2,648 | $227,400 | $14,000 | $76,960 |
| 2015 | $2,486 | $211,400 | $14,000 | $70,560 |
| 2014 | $2,297 | $194,900 | $14,000 | $63,960 |
Source: Public Records
Map
Nearby Homes
- 406 Ballymore Pass Unit III
- 416 Ballymore Pass
- 1001 Ashfern Walk
- 128 Golden Hills Dr
- 135 Golden Hills Dr
- 712 Copper Trace Way
- 606 Wood Ridge Dr
- 727 Copper Trace Way
- 233 Shoals Bridge Rd
- 234 Ascott Ln
- 215 Carmichael Rd
- 1516 Shadow Ridge Cir
- 0 Black Oak Trail Unit 7303191
- 0 Black Oak Trail Unit 10267626
- 923 Pine Cir
- 520 Regency Dr
- 104 Southfork Dr
- 104 Rose Cottage Ln Unit 65
- 4005 Watkins Glen Dr
- 1463 Kellogg Creek Rd
- 405 Ballymore Pass Unit Gaa013
- 405 Ballymore Pass Unit GAA0136
- 405 Ballymore Pass
- 403 Ballymore Pass
- 407 Ballymore Pass
- 1034 Ashfern Walk
- 1032 Ashfern Walk
- 409 Ballymore Pass
- 1036 Ashfern Walk Unit 2
- 2015 Castlemaine Cir
- 404 Ballymore Pass Unit III
- 2011 Castlemaine Cir
- 2013 Castlemaine Cir Unit 2
- 2021 Castlemaine Cir
- 411 Ballymore Pass
- 1038 Ashfern Walk
- 1030 Ashfern Walk
- 1025 Ashfern Walk Unit 2
- 2022 Castlemaine Cir
- 2024 Castlemaine Cir