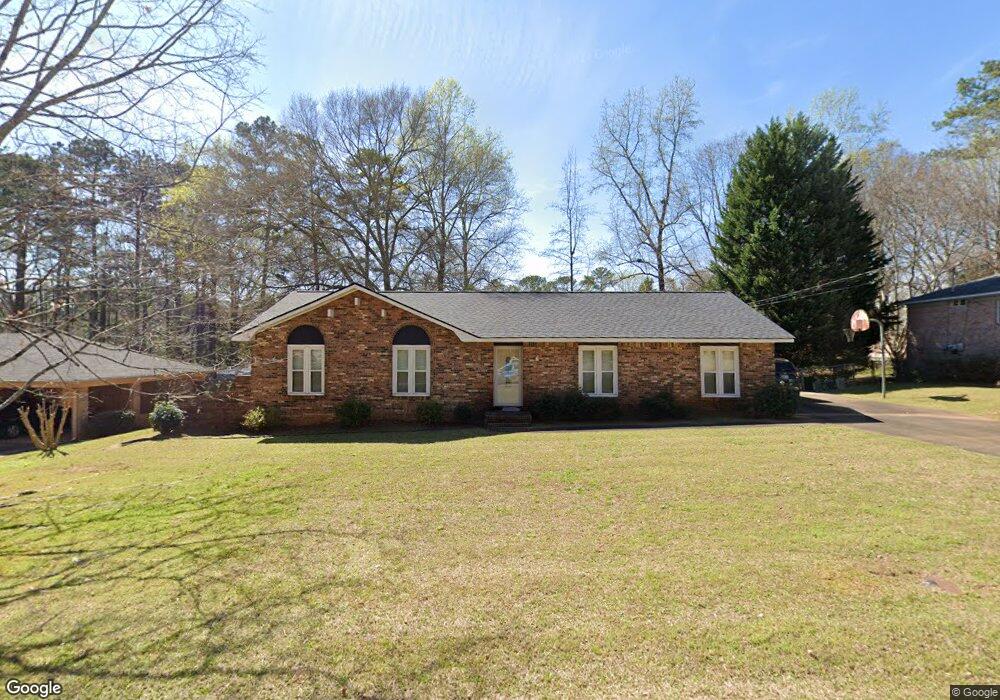
405 Camelot Dr Lagrange, GA 30241
Estimated Value: $212,774 - $244,000
4
Beds
2
Baths
1,698
Sq Ft
$136/Sq Ft
Est. Value
About This Home
This home is located at 405 Camelot Dr, Lagrange, GA 30241 and is currently estimated at $231,444, approximately $136 per square foot. 405 Camelot Dr is a home located in Troup County with nearby schools including Franklin Forest Elementary School, Hollis Hand Elementary School, and Ethel W. Kight Elementary School.
Ownership History
Date
Name
Owned For
Owner Type
Purchase Details
Closed on
Mar 4, 2025
Sold by
Barnes Shirley J
Bought by
Duffy Patrick Mathew
Current Estimated Value
Purchase Details
Closed on
Feb 9, 2000
Sold by
Paul Barnes E
Bought by
Barnes Shirley J
Purchase Details
Closed on
Dec 1, 1986
Bought by
Paul Barnes E
Purchase Details
Closed on
Nov 15, 1980
Sold by
George B Tate
Purchase Details
Closed on
Jan 31, 1980
Sold by
Katie David and Katie Spencer
Bought by
George B Tate
Purchase Details
Closed on
Nov 28, 1978
Sold by
Revonda James and Revonda Holliday
Bought by
Katie David and Katie Spencer
Purchase Details
Closed on
Apr 22, 1977
Sold by
Dora Thomas and Dora Daniluk
Bought by
Revonda James and Revonda Holliday
Purchase Details
Closed on
Jan 21, 1977
Sold by
Lagrange Investment Co
Bought by
Dora Thomas and Dora Daniluk
Create a Home Valuation Report for This Property
The Home Valuation Report is an in-depth analysis detailing your home's value as well as a comparison with similar homes in the area
Purchase History
| Date | Buyer | Sale Price | Title Company |
|---|---|---|---|
| Duffy Patrick Mathew | -- | -- | |
| Barnes Shirley J | -- | -- | |
| Paul Barnes E | -- | -- | |
| -- | -- | -- | |
| George B Tate | -- | -- | |
| Katie David | -- | -- | |
| Revonda James | -- | -- | |
| Dora Thomas | -- | -- |
Source: Public Records
Tax History
| Year | Tax Paid | Tax Assessment Tax Assessment Total Assessment is a certain percentage of the fair market value that is determined by local assessors to be the total taxable value of land and additions on the property. | Land | Improvement |
|---|---|---|---|---|
| 2025 | $1,663 | $75,192 | $10,000 | $65,192 |
| 2024 | $1,663 | $62,952 | $10,000 | $52,952 |
| 2023 | $1,506 | $57,192 | $10,000 | $47,192 |
| 2022 | $1,453 | $54,032 | $10,000 | $44,032 |
| 2021 | $1,180 | $41,116 | $8,000 | $33,116 |
| 2020 | $1,180 | $41,116 | $8,000 | $33,116 |
| 2019 | $1,224 | $42,556 | $8,000 | $34,556 |
| 2018 | $991 | $34,832 | $6,200 | $28,632 |
| 2017 | $991 | $34,832 | $6,200 | $28,632 |
| 2016 | $954 | $33,626 | $6,000 | $27,626 |
| 2015 | $903 | $31,853 | $6,240 | $25,613 |
| 2014 | $863 | $30,505 | $6,240 | $24,265 |
| 2013 | -- | $32,500 | $6,240 | $26,260 |
Source: Public Records
Map
Nearby Homes
- 102 Dogwood Dr
- 210 Hearthstone Dr
- 224 Rutland Cir
- 202 Park Hill Dr
- 114 Briarcliff Rd
- 121 Ct
- 706 N Harlem Cir
- 806 New Franklin Rd
- 618 S Harlem Cir
- 616 S Harlem Cir
- 608 S Harlem Cir
- 606 S Harlem Cir
- 600 S Harlem Cir
- 110 Russell St
- 204 Colonial St
- 900 North St
- 134 S Page St
- 305 Lenox Cir
- 110 Lenox Cir
- 115 Clara Jean Ct
- 403 Camelot Dr
- 407 Camelot Dr
- 308 Valley Ct
- 404 Camelot Dr
- 306 Valley Ct
- 406 Camelot Dr
- 401 Camelot Dr
- 401 Camelot Dr Unit 50
- 409 Camelot Dr
- 402 Camelot Dr
- 310 Valley Ct
- 310 Valley Ct Unit 45
- 304 Valley Ct
- 470 Hickory Terrace
- 411 Camelot Dr
- 408 Camelot Dr
- 401 Somerset Place
- 400 Camelot Dr
- 410 Camelot Dr
- 468 Hickory Terrace