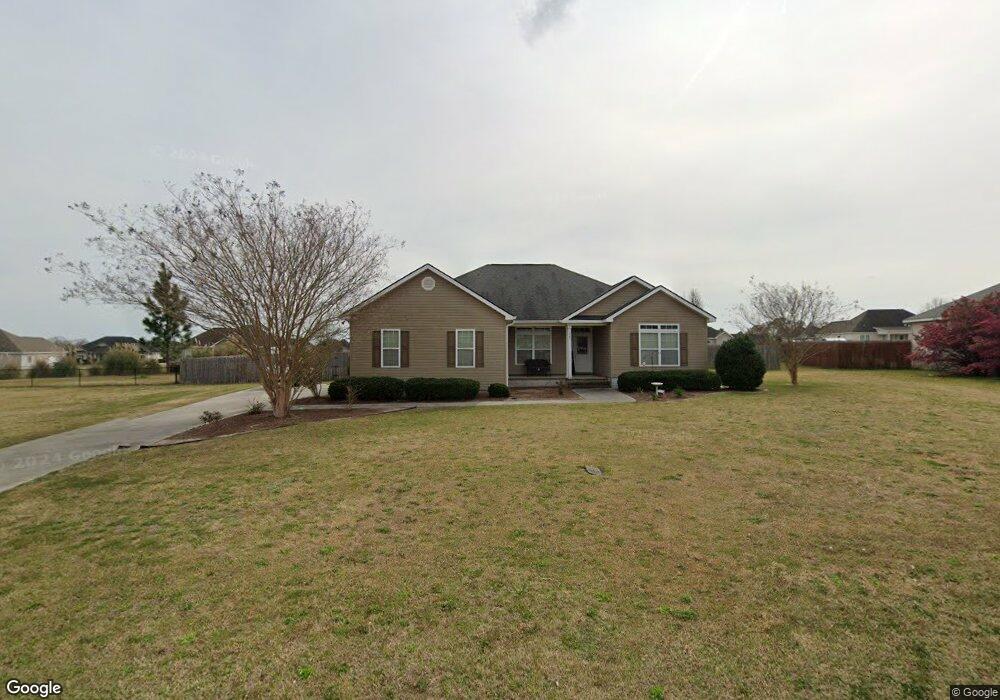
405 Driftwood Ct Statesboro, GA 30458
Estimated Value: $312,928 - $323,000
3
Beds
2
Baths
1,900
Sq Ft
$167/Sq Ft
Est. Value
About This Home
This home is located at 405 Driftwood Ct, Statesboro, GA 30458 and is currently estimated at $316,732, approximately $166 per square foot. 405 Driftwood Ct is a home located in Bulloch County with nearby schools including Langston Chapel Elementary School, Statesboro High School, and Langston Chapel Middle School.
Ownership History
Date
Name
Owned For
Owner Type
Purchase Details
Closed on
Mar 29, 2019
Sold by
Williams Tom Charles
Bought by
Badgett Brandon M and Badgett Rebecca A
Current Estimated Value
Home Financials for this Owner
Home Financials are based on the most recent Mortgage that was taken out on this home.
Original Mortgage
$155,000
Outstanding Balance
$136,273
Interest Rate
4.3%
Mortgage Type
New Conventional
Estimated Equity
$180,459
Purchase Details
Closed on
Mar 12, 2012
Bought by
Williams Tom Charles
Home Financials for this Owner
Home Financials are based on the most recent Mortgage that was taken out on this home.
Original Mortgage
$149,183
Interest Rate
3.89%
Mortgage Type
New Conventional
Purchase Details
Closed on
Oct 21, 2011
Sold by
Dismukes Matthew Cantrell
Bought by
C & D Construction
Purchase Details
Closed on
Aug 5, 2005
Bought by
Woodbridge Development Inc
Create a Home Valuation Report for This Property
The Home Valuation Report is an in-depth analysis detailing your home's value as well as a comparison with similar homes in the area
Home Values in the Area
Average Home Value in this Area
Purchase History
| Date | Buyer | Sale Price | Title Company |
|---|---|---|---|
| Badgett Brandon M | $180,000 | -- | |
| Williams Tom Charles | $146,200 | -- | |
| C & D Construction | -- | -- | |
| Woodbridge Development Inc | -- | -- |
Source: Public Records
Mortgage History
| Date | Status | Borrower | Loan Amount |
|---|---|---|---|
| Open | Badgett Brandon M | $155,000 | |
| Previous Owner | Williams Tom Charles | $149,183 |
Source: Public Records
Tax History Compared to Growth
Tax History
| Year | Tax Paid | Tax Assessment Tax Assessment Total Assessment is a certain percentage of the fair market value that is determined by local assessors to be the total taxable value of land and additions on the property. | Land | Improvement |
|---|---|---|---|---|
| 2024 | $2,542 | $115,640 | $20,000 | $95,640 |
| 2023 | $2,513 | $104,600 | $14,000 | $90,600 |
| 2022 | $1,919 | $87,762 | $10,240 | $77,522 |
| 2021 | $1,662 | $74,135 | $10,240 | $63,895 |
| 2020 | $1,579 | $70,002 | $10,240 | $59,762 |
| 2019 | $1,561 | $68,868 | $10,240 | $58,628 |
| 2018 | $1,561 | $66,240 | $8,784 | $57,456 |
| 2017 | $1,521 | $63,821 | $8,784 | $55,037 |
| 2016 | $1,498 | $61,402 | $8,784 | $52,618 |
| 2015 | $1,468 | $59,928 | $8,784 | $51,144 |
| 2014 | $1,357 | $59,928 | $8,784 | $51,144 |
Source: Public Records
Map
Nearby Homes
- 258 Stonebrook Way
- 412 Mayberry Way
- 310 Barney Run Unit 173
- 512 Colquitt Ln
- 310 Parkersburg Ln Unit 50
- 216 Aunt Bee Blvd
- 208 Hopecrest Rd Unit 63
- 209 Hopecrest Rd
- 210 Hopecrest Rd Unit 62
- 208 Hopecrest Rd
- 210 Hopecrest Rd
- 206 Aunt Bee Blvd
- 208 Aunt Bee Blvd
- 202 Aunt Bee Blvd
- 205 Sawtooth Ct
- 171 Stonebrook Way
- 149 Griffith Ln
- 126 Enclave Ct Unit LOT 19
- 122 Enclave Ct Unit LOT 20
- 118 Enclave Ct Unit LOT 21
- 407 Driftwood Ct
- 407 Driftwood Ct Unit 93
- 403 Driftwood Ct
- 317 Leyland Rd
- 319 Leyland Rd
- 315 Leyland Rd
- 406 Driftwood Ct
- 409 Driftwood Ct
- 409 Driftwood Ct Unit 94
- 321 Leyland Rd
- 313 Leyland Rd
- 401 Driftwood Ct
- 402 Driftwood Ct
- 408 Driftwood Ct
- 411 Driftwood Ct
- 257 Canterberry Place
- 323 Leyland Rd
- 311 Leyland Rd Unit 6
- 311 Leyland Rd
- 318 Leyland Rd