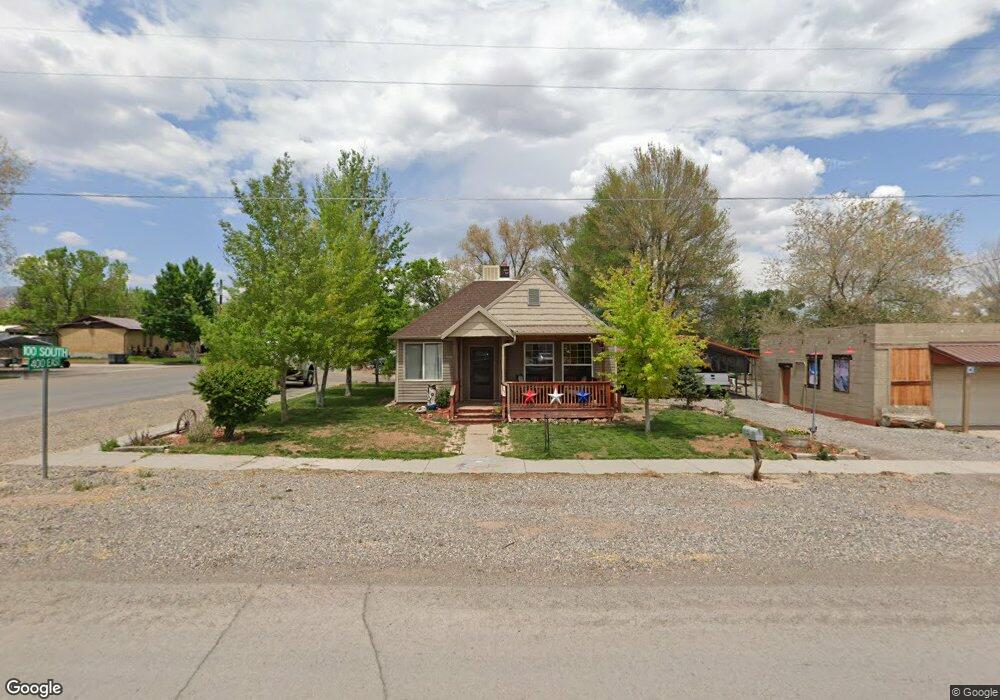
405 E 100 S Richfield, UT 84701
Estimated Value: $211,357 - $257,000
2
Beds
1
Bath
980
Sq Ft
$235/Sq Ft
Est. Value
About This Home
This home is located at 405 E 100 S, Richfield, UT 84701 and is currently estimated at $230,089, approximately $234 per square foot. 405 E 100 S is a home located in Sevier County with nearby schools including Ashman School, Pahvant School, and Red Hills Middle School.
Ownership History
Date
Name
Owned For
Owner Type
Purchase Details
Closed on
Sep 26, 2023
Sold by
Thornton Duane and Thornton Rondi
Bought by
John Clay And Mary Kaye Keele-Thornton Irrevo and Keele
Current Estimated Value
Purchase Details
Closed on
Jul 3, 2023
Sold by
Healey Tess
Bought by
Thornton Duane and Thornton Rondi
Purchase Details
Closed on
Apr 30, 2021
Sold by
Hayes Lynda
Bought by
Healey Tess
Home Financials for this Owner
Home Financials are based on the most recent Mortgage that was taken out on this home.
Original Mortgage
$10,100
Interest Rate
3%
Mortgage Type
New Conventional
Purchase Details
Closed on
Sep 28, 2017
Sold by
Hayes Lynda Lee and Williams Gregory Foch
Bought by
Hayes Lynda and Williams Gregory
Home Financials for this Owner
Home Financials are based on the most recent Mortgage that was taken out on this home.
Original Mortgage
$72,000
Interest Rate
3.89%
Mortgage Type
New Conventional
Create a Home Valuation Report for This Property
The Home Valuation Report is an in-depth analysis detailing your home's value as well as a comparison with similar homes in the area
Purchase History
| Date | Buyer | Sale Price | Title Company |
|---|---|---|---|
| John Clay And Mary Kaye Keele-Thornton Irrevo | -- | First American Title | |
| Thornton Duane | -- | First American Title | |
| Healey Tess | -- | First American Title | |
| Hayes Lynda | -- | D Land Title |
Source: Public Records
Mortgage History
| Date | Status | Borrower | Loan Amount |
|---|---|---|---|
| Previous Owner | Healey Tess | $10,100 | |
| Previous Owner | Healey Tess | $176,739 | |
| Previous Owner | Hayes Lynda | $72,000 |
Source: Public Records
Tax History
| Year | Tax Paid | Tax Assessment Tax Assessment Total Assessment is a certain percentage of the fair market value that is determined by local assessors to be the total taxable value of land and additions on the property. | Land | Improvement |
|---|---|---|---|---|
| 2025 | $1,016 | $104,675 | $40,619 | $64,056 |
| 2024 | $1,016 | $105,812 | $33,267 | $72,545 |
| 2023 | $1,047 | $112,069 | $30,657 | $81,412 |
| 2022 | $1,068 | $97,480 | $25,983 | $71,497 |
| 2021 | $971 | $74,618 | $26,865 | $47,753 |
| 2020 | $817 | $61,005 | $18,711 | $42,294 |
| 2019 | $691 | $54,620 | $15,590 | $39,030 |
| 2018 | $697 | $49,400 | $15,590 | $33,810 |
| 2017 | $682 | $46,140 | $15,590 | $30,550 |
| 2016 | $476 | $46,140 | $0 | $0 |
| 2015 | $476 | $38,530 | $0 | $0 |
| 2014 | $476 | $36,760 | $0 | $0 |
Source: Public Records
Map
Nearby Homes
Your Personal Tour Guide
Ask me questions while you tour the home.