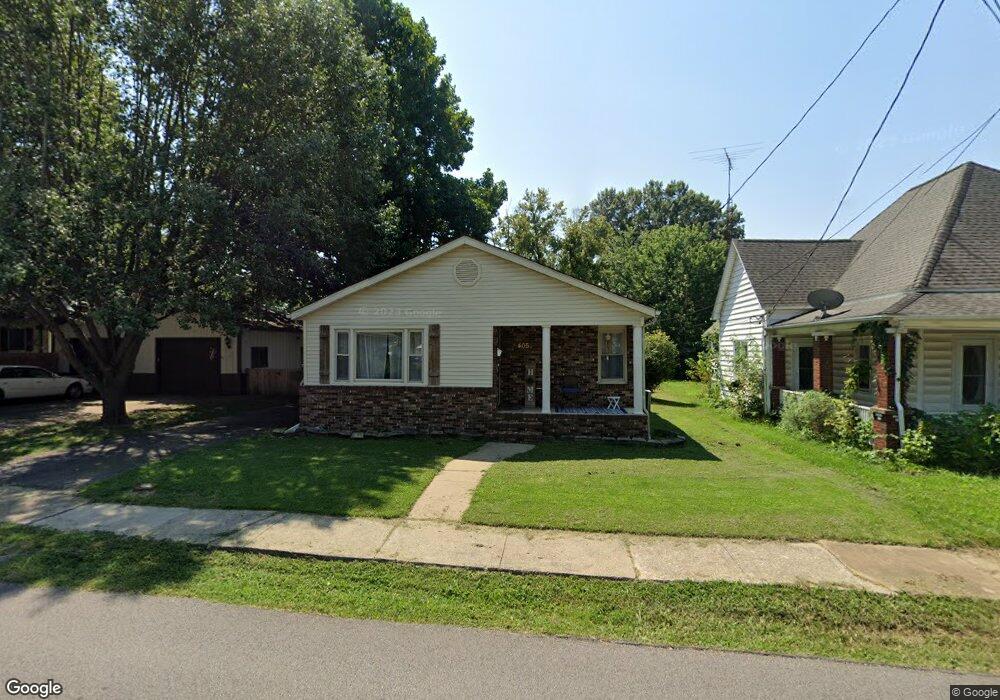
405 E 9th St Johnston City, IL 62951
Estimated Value: $110,000 - $178,000
--
Bed
--
Bath
1,482
Sq Ft
$96/Sq Ft
Est. Value
About This Home
This home is located at 405 E 9th St, Johnston City, IL 62951 and is currently estimated at $142,962, approximately $96 per square foot. 405 E 9th St is a home located in Williamson County with nearby schools including Johnston City High School and Community Christian Academy.
Ownership History
Date
Name
Owned For
Owner Type
Purchase Details
Closed on
Jul 16, 2021
Sold by
Coulson Gwendolyn M
Bought by
Gream Gregory T
Current Estimated Value
Home Financials for this Owner
Home Financials are based on the most recent Mortgage that was taken out on this home.
Original Mortgage
$99,000
Outstanding Balance
$90,471
Interest Rate
3.38%
Mortgage Type
New Conventional
Estimated Equity
$52,492
Purchase Details
Closed on
Mar 13, 2019
Sold by
Schiff Joint Trust
Bought by
Coulson Gwendolyn M and Cobb Laura
Create a Home Valuation Report for This Property
The Home Valuation Report is an in-depth analysis detailing your home's value as well as a comparison with similar homes in the area
Home Values in the Area
Average Home Value in this Area
Purchase History
| Date | Buyer | Sale Price | Title Company |
|---|---|---|---|
| Gream Gregory T | $110,000 | Law Offices Of Kacey Eisenhaue | |
| Coulson Gwendolyn M | -- | Barrett Twomey Broom Hughes & |
Source: Public Records
Mortgage History
| Date | Status | Borrower | Loan Amount |
|---|---|---|---|
| Open | Gream Gregory T | $99,000 |
Source: Public Records
Tax History Compared to Growth
Tax History
| Year | Tax Paid | Tax Assessment Tax Assessment Total Assessment is a certain percentage of the fair market value that is determined by local assessors to be the total taxable value of land and additions on the property. | Land | Improvement |
|---|---|---|---|---|
| 2025 | $2,544 | $31,170 | $2,280 | $28,890 |
| 2024 | $2,544 | $31,170 | $2,280 | $28,890 |
| 2023 | $2,544 | $31,170 | $2,280 | $28,890 |
| 2022 | $2,191 | $27,460 | $2,010 | $25,450 |
| 2021 | $2,157 | $24,580 | $1,940 | $22,640 |
| 2020 | $2,157 | $23,220 | $1,830 | $21,390 |
| 2019 | $2,014 | $23,220 | $1,830 | $21,390 |
| 2018 | $2,014 | $23,220 | $1,830 | $21,390 |
| 2017 | $1,998 | $23,220 | $1,830 | $21,390 |
| 2015 | $1,964 | $21,990 | $1,730 | $20,260 |
| 2013 | $1,727 | $21,990 | $1,730 | $20,260 |
| 2012 | $1,727 | $21,990 | $1,730 | $20,260 |
Source: Public Records
Map
Nearby Homes