
Seller's Agent in 2016
Mindy Vance
Kelly Right Pullman
(208) 301-3588
77 Total Sales

Estimated Value: $355,000 - $415,000
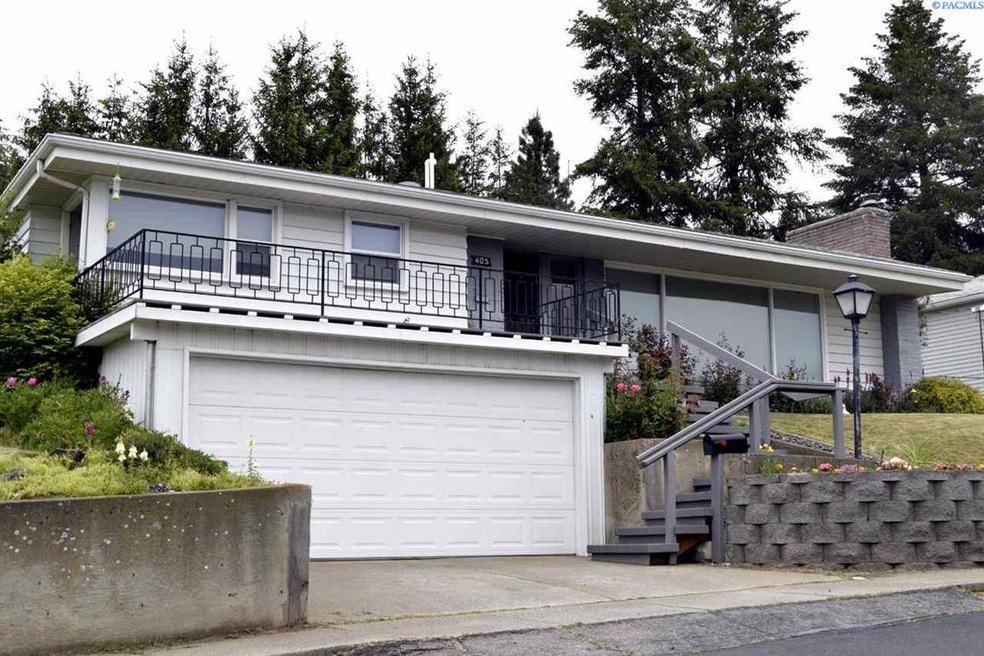
Motivated Seller! This classic 1952 quality custom home was built for doctor in an upscale neighborhood of Colfax. Solid construction with lots of extra features boasts of multiple built-ins with custom trim, built in desk, large view windows and new floors. Main level has large master bedroom suite with an entry enclave and full bath as well as 2 more generous bedrooms and additional full bath. Lots of cabinets in this sunny bright kitchen and breakfast nook. Downstairs has a 4th non-conforming bedroom and 3/4 bath, huge family room with kitchenette/bar and masonry fireplace, large utility room, additional room and lots of storage! Deep garage with extra storage . Covered patio in the back with private back yard. Don't miss this treasure with a view, all on a quiet street.
Last Agent to Sell the Property
Kelly Right Pullman License #115321 Listed on: 05/25/2016
We collect this data history from publicly available records. To have your information removed, we recommend requesting removal directly through your county’s website.
| Date | Event | Price | List to Sale | Price per Sq Ft | Prior Sale |
|---|---|---|---|---|---|
| 11/18/2016 11/18/16 | Sold | $195,000 | -11.4% | $62 / Sq Ft | |
| 08/31/2016 08/31/16 | Pending | -- | -- | -- | |
| 05/25/2016 05/25/16 | For Sale | $220,000 | +28.2% | $70 / Sq Ft | |
| 11/17/2014 11/17/14 | Sold | $171,600 | -4.7% | $55 / Sq Ft | View Prior Sale |
| 11/17/2014 11/17/14 | Pending | -- | -- | -- | |
| 08/11/2014 08/11/14 | For Sale | $180,000 | -- | $58 / Sq Ft |
We collect this data history from publicly available records. To have your information removed, we recommend requesting removal directly through your county’s website.
| Year | Tax Paid | Tax Assessment Tax Assessment Total Assessment is a certain percentage of the fair market value that is determined by local assessors to be the total taxable value of land and additions on the property. | Land | Improvement |
|---|---|---|---|---|
| 2026 | $2,152 | $204,800 | $24,750 | $180,050 |
| 2025 | $2,346 | $179,190 | $10,005 | $169,185 |
| 2024 | $2,143 | $155,817 | $8,700 | $147,117 |
| 2023 | $2,324 | $155,817 | $8,700 | $147,117 |
| 2022 | $2,300 | $155,817 | $8,700 | $147,117 |
| 2021 | $2,227 | $155,817 | $8,700 | $147,117 |
| 2020 | $2,194 | $155,817 | $8,700 | $147,117 |
| 2019 | $2,059 | $150,160 | $8,700 | $141,460 |
| 2018 | $2,223 | $150,160 | $8,700 | $141,460 |
| 2017 | $1,869 | $150,160 | $8,700 | $141,460 |
| 2016 | $2,066 | $150,160 | $8,700 | $141,460 |
| 2015 | $2,009 | $150,160 | $8,700 | $141,460 |
| 2014 | -- | $137,300 | $8,700 | $128,600 |
Seller's Agent in 2016
Mindy Vance
Kelly Right Pullman
(208) 301-3588
77 Total Sales
Buyer's Agent in 2016
DeAnn Billing
United Country Real Estate - Team Washington
(208) 596-8811
66 Total Sales
J
Seller's Agent in 2014
Jeri Rainer
Kelly Right Pullman
Source: Pacific Regional MLS
MLS Number: 213961
APN: 100800002050000
Disclaimer: Certain information contained herein is derived from information provided by parties other than Homes.com. All information provided is deemed reliable, but is not guaranteed to be accurate and should be independently verified.
![]() Based on information submitted to the MLS GRID. All data is obtained from various sources and may not have been verified by broker or MLS GRID. Supplied Open House Information is subject to change without notice. All information should be independently reviewed and verified for accuracy. Properties may or may not be listed by the office/agent presenting the information. Some IDX listings have been excluded from this website. IDX information is provided exclusively for personal, non-commercial use, and may not be used for any purpose other than to identify prospective properties consumers may be interested in purchasing. Information is deemed reliable but not guaranteed.
Based on information submitted to the MLS GRID. All data is obtained from various sources and may not have been verified by broker or MLS GRID. Supplied Open House Information is subject to change without notice. All information should be independently reviewed and verified for accuracy. Properties may or may not be listed by the office/agent presenting the information. Some IDX listings have been excluded from this website. IDX information is provided exclusively for personal, non-commercial use, and may not be used for any purpose other than to identify prospective properties consumers may be interested in purchasing. Information is deemed reliable but not guaranteed.
Based on information submitted to the MLS GRID
Ask me questions while you tour the home.