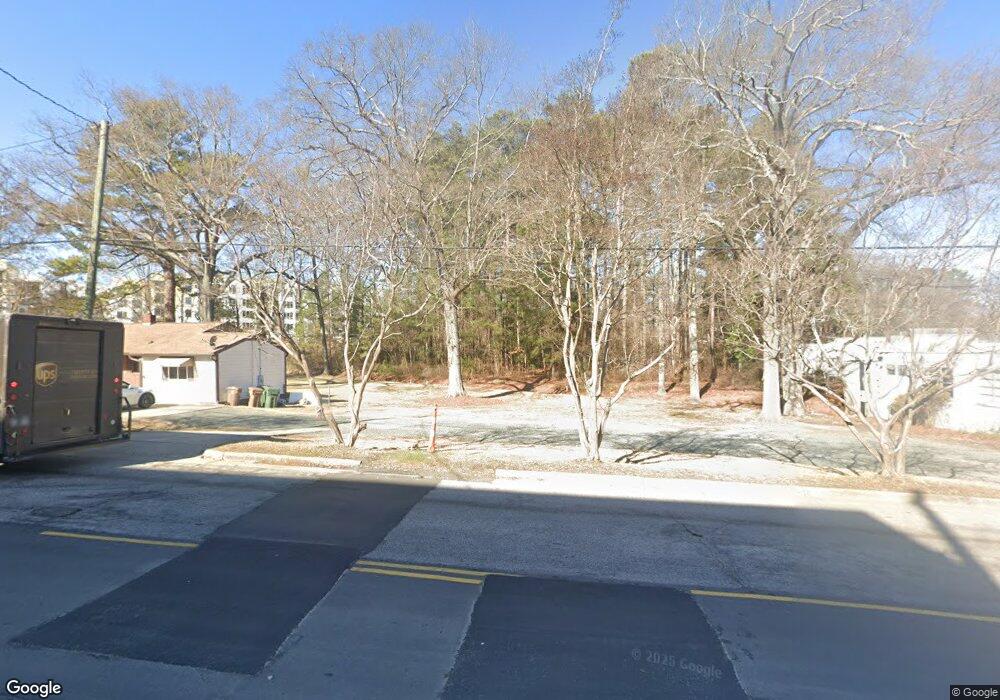
405 E Chatham St Cary, NC 27511
Downtown Cary NeighborhoodEstimated Value: $683,555 - $693,000
Studio
2
Baths
1,487
Sq Ft
$463/Sq Ft
Est. Value
About This Home
This home is located at 405 E Chatham St, Cary, NC 27511 and is currently estimated at $688,278, approximately $462 per square foot. 405 E Chatham St is a home located in Wake County with nearby schools including Cary Elementary, East Cary Middle School, and Cary High School.
Ownership History
Date
Name
Owned For
Owner Type
Purchase Details
Closed on
Aug 25, 2021
Sold by
Gupta Bhola N and Gupta Radha L
Bought by
George Ii Jordan Iii Development Company
Current Estimated Value
Purchase Details
Closed on
Aug 16, 2021
Sold by
Gupta Sanjal K and Baegas Wilson G
Bought by
Gupta Bhola N
Purchase Details
Closed on
Jul 2, 1984
Bought by
Gupta Bhola N and Gupta Radha L
Create a Home Valuation Report for This Property
The Home Valuation Report is an in-depth analysis detailing your home's value as well as a comparison with similar homes in the area
Home Values in the Area
Average Home Value in this Area
Purchase History
| Date | Buyer | Sale Price | Title Company |
|---|---|---|---|
| George Ii Jordan Iii Development Company | -- | None Listed On Document | |
| George H Jordan Iii Development Co Inc | $600,000 | None Available | |
| Gupta Bhola N | -- | None Available | |
| Gupta Bhola N | $65,000 | -- |
Source: Public Records
Tax History Compared to Growth
Tax History
| Year | Tax Paid | Tax Assessment Tax Assessment Total Assessment is a certain percentage of the fair market value that is determined by local assessors to be the total taxable value of land and additions on the property. | Land | Improvement |
|---|---|---|---|---|
| 2025 | $5,824 | $679,536 | $679,536 | -- |
| 2024 | $5,698 | $679,536 | $679,536 | $0 |
Source: Public Records
Map
Nearby Homes
- 400 E Chatham St
- 408 E Chatham St
- 105 Chatham Walk Ln Unit 102
- 105 Chatham Walk Ln Unit 204
- 105 Chatham Walk Ln Unit 210
- 407 Waldo St
- 320 Waldo St
- 315 Waldo St
- 400 Field St
- 415 Webster St
- 307 Keener St
- 519 Sorrell St
- 511 Sorrell St
- 110 Penchant Ct
- 517 Sorrell St
- 226 Fairview Rd
- 703 Rosefield Dr
- 127 E Park St
- 200 Walnut St
- 109 W Park St
