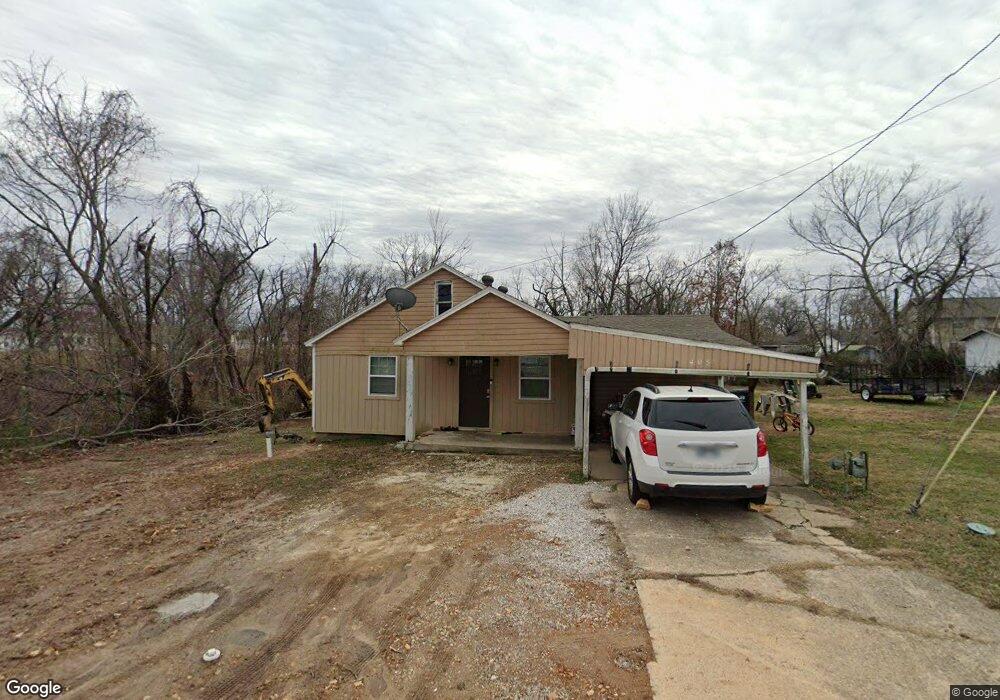
405 E Hemlock St Rogers, AR 72756
Estimated Value: $211,000 - $273,000
3
Beds
1
Bath
1,230
Sq Ft
$191/Sq Ft
Est. Value
About This Home
This home is located at 405 E Hemlock St, Rogers, AR 72756 and is currently estimated at $234,609, approximately $190 per square foot. 405 E Hemlock St is a home located in Benton County with nearby schools including Frank Tillery Elementary School, Lingle Middle School, and Rogers Heritage High School.
Ownership History
Date
Name
Owned For
Owner Type
Purchase Details
Closed on
Jun 26, 2025
Sold by
Gonzalez Mario and Gonzalez Olga
Bought by
Ibanez Vanessa
Current Estimated Value
Purchase Details
Closed on
Oct 4, 2004
Bought by
Gonzalez
Purchase Details
Closed on
Oct 23, 1996
Bought by
Bearden
Purchase Details
Closed on
Nov 1, 1993
Bought by
Boyd Living Tr
Purchase Details
Closed on
Oct 26, 1993
Bought by
Boyd Living Tr
Purchase Details
Closed on
Feb 7, 1983
Bought by
Boyd
Create a Home Valuation Report for This Property
The Home Valuation Report is an in-depth analysis detailing your home's value as well as a comparison with similar homes in the area
Purchase History
| Date | Buyer | Sale Price | Title Company |
|---|---|---|---|
| Ibanez Vanessa | -- | None Listed On Document | |
| Gonzalez | $45,000 | -- | |
| Gonzalez | $45,000 | -- | |
| Bearden | $43,000 | -- | |
| Raymond Raymond M | -- | -- | |
| Florence Florence M | -- | -- | |
| Boyd Living Tr | -- | -- | |
| Boyd Living Tr | -- | -- | |
| Boyd | -- | -- |
Source: Public Records
Tax History
| Year | Tax Paid | Tax Assessment Tax Assessment Total Assessment is a certain percentage of the fair market value that is determined by local assessors to be the total taxable value of land and additions on the property. | Land | Improvement |
|---|---|---|---|---|
| 2025 | $1,619 | $29,864 | $8,000 | $21,864 |
| 2024 | $924 | $22,007 | $8,000 | $14,007 |
| 2023 | $840 | $16,820 | $8,000 | $8,820 |
| 2022 | $810 | $16,820 | $8,000 | $8,820 |
| 2021 | $745 | $16,820 | $8,000 | $8,820 |
| 2020 | $633 | $11,530 | $4,000 | $7,530 |
| 2019 | $601 | $11,530 | $4,000 | $7,530 |
| 2018 | $558 | $11,530 | $4,000 | $7,530 |
| 2017 | $447 | $11,530 | $4,000 | $7,530 |
| 2016 | $447 | $11,530 | $4,000 | $7,530 |
| 2015 | $412 | $7,790 | $2,800 | $4,990 |
| 2014 | $412 | $7,790 | $2,800 | $4,990 |
Source: Public Records
Map
Nearby Homes
- 508 E Spruce St
- 1409 N Arkansas St
- 418,420,422,424 N F St
- 615 N 3rd St
- 615 & 615 1/2 N 3rd St
- 220 N C St
- 832 E Hilltop Dr
- 509 E Walnut St
- 814 Summit Loop
- 832 Atalanta Dr
- 516 E Pearl St
- 0 E Spring St
- 511 Spring St
- 403 6th St
- 1.47 Acres E Allen St
- 718 W Maple St
- 805 W Norwood St
- 510 N 8th St
- 0 N Hilltop Cir
- 908 N 9th St
- 402 E Hemlock St
- 737 N C St
- 400 E Hemlock St
- Lot 46 Warren Glenn S D Ave
- Lot 48 Warren Glenn S D Ave
- Lot 56 Warren Glenn S D Ave
- Lot 38 Hearthstone S D
- Lot 40 Hearthstone S D
- Lot 02 Hearthstone S D
- Lot 04 Hearthstone S D
- Lot 08 Hearthstone S D
- Lot 10 Hearthstone S D
- Lot 62 Hearthstone S D
- Lot 64 Hearthstone S D
- Lot 82 Hearthstone S D
- Lot 34 Hearthstone S D
- 0
- Lot 36 Hearthstone S D
- 735 N C St
- 1008 N D St
Your Personal Tour Guide
Ask me questions while you tour the home.