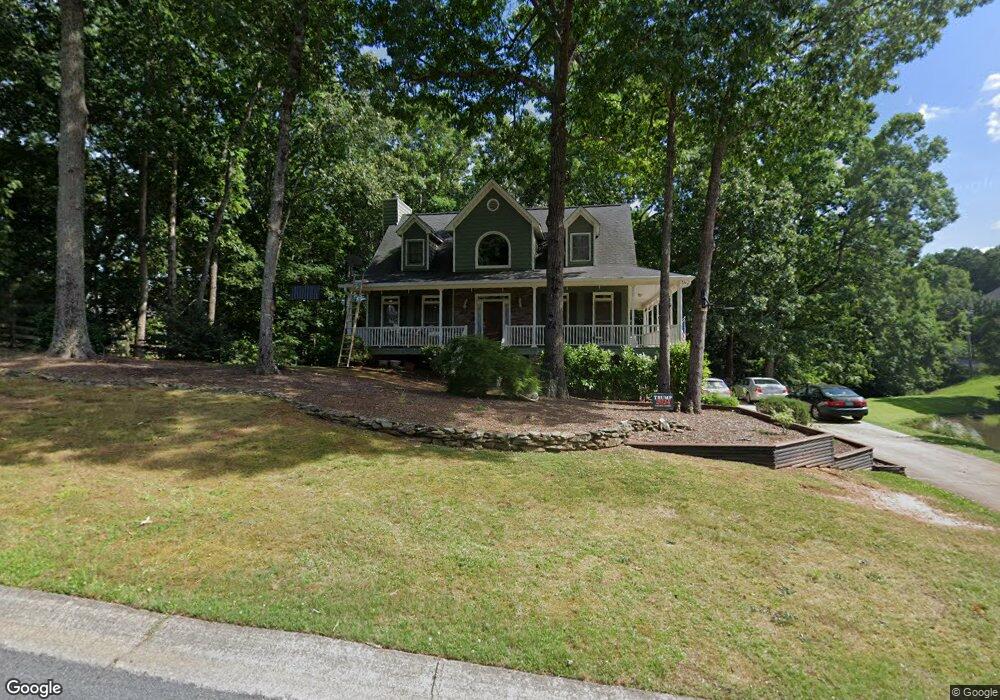
405 Eagle Ridge Trail Unit 3 Canton, GA 30114
Oak Grove NeighborhoodEstimated Value: $504,000 - $521,233
4
Beds
4
Baths
2,788
Sq Ft
$184/Sq Ft
Est. Value
About This Home
This home is located at 405 Eagle Ridge Trail Unit 3, Canton, GA 30114 and is currently estimated at $512,617, approximately $183 per square foot. 405 Eagle Ridge Trail Unit 3 is a home located in Cherokee County with nearby schools including Sixes Elementary School, Freedom Middle School, and Woodstock High School.
Ownership History
Date
Name
Owned For
Owner Type
Purchase Details
Closed on
Feb 8, 2013
Sold by
Bracegirdle Sharon E
Bought by
Bracegirdle James G and Bracegirdle Sharon E
Current Estimated Value
Home Financials for this Owner
Home Financials are based on the most recent Mortgage that was taken out on this home.
Original Mortgage
$164,500
Outstanding Balance
$114,293
Interest Rate
3.43%
Mortgage Type
New Conventional
Estimated Equity
$398,324
Purchase Details
Closed on
Jun 2, 2004
Sold by
Brucegirdle James G
Bought by
Brucegirdle Sharon E
Purchase Details
Closed on
Apr 17, 1997
Sold by
Simpson Max
Bought by
Bracegirdle James G and Bracegirdle Sharon E
Home Financials for this Owner
Home Financials are based on the most recent Mortgage that was taken out on this home.
Original Mortgage
$143,600
Interest Rate
7.85%
Mortgage Type
New Conventional
Create a Home Valuation Report for This Property
The Home Valuation Report is an in-depth analysis detailing your home's value as well as a comparison with similar homes in the area
Home Values in the Area
Average Home Value in this Area
Purchase History
| Date | Buyer | Sale Price | Title Company |
|---|---|---|---|
| Bracegirdle James G | -- | -- | |
| Brucegirdle Sharon E | -- | -- | |
| Bracegirdle James G | $179,500 | -- |
Source: Public Records
Mortgage History
| Date | Status | Borrower | Loan Amount |
|---|---|---|---|
| Open | Bracegirdle James G | $164,500 | |
| Previous Owner | Bracegirdle James G | $143,600 |
Source: Public Records
Tax History
| Year | Tax Paid | Tax Assessment Tax Assessment Total Assessment is a certain percentage of the fair market value that is determined by local assessors to be the total taxable value of land and additions on the property. | Land | Improvement |
|---|---|---|---|---|
| 2025 | $1,177 | $211,892 | $49,400 | $162,492 |
| 2024 | $4,848 | $208,372 | $46,800 | $161,572 |
| 2023 | $3,980 | $187,812 | $44,200 | $143,612 |
| 2022 | $4,224 | $176,412 | $39,000 | $137,412 |
| 2021 | $3,812 | $143,456 | $34,560 | $108,896 |
| 2020 | $3,514 | $130,456 | $31,200 | $99,256 |
| 2019 | $2,909 | $106,920 | $24,440 | $82,480 |
| 2018 | $2,809 | $101,960 | $24,440 | $77,520 |
| 2017 | $2,790 | $250,600 | $25,480 | $74,760 |
| 2016 | $2,756 | $244,100 | $25,480 | $72,160 |
| 2015 | $2,382 | $208,300 | $23,120 | $60,200 |
| 2014 | $2,130 | $186,500 | $17,680 | $56,920 |
Source: Public Records
Map
Nearby Homes
- 779 Holly St
- 305 Ridge Rd
- 325 Gold Ridge
- 6055 Golden Landing
- 605 Garnet Ct Unit 3
- 103 Prominence Ct
- 0 Sixes Creek Trail Unit 7197452
- 9764 Bells Ferry Rd
- 148 Reddin Dr
- 190 Sixes Creek Trail
- 151 Prominence Ct
- 187 Sixes Creek Trail
- 350 Meadows Ln
- 329 Meadows Ln
- 304 Meadows Ln Unit 2
- 645 Mile Branch Rd
- 114 Overlook Ridge Way
- 0 Sixes Rd Unit 7522480
- 0 Sixes Rd Unit 10701921
- 265 Trecastle Square
- 305 Eagle Ridge Place
- 303 Eagle Ridge Place Unit 3
- 404 Eagle Ridge Trail Unit 3
- 402 Eagle Ridge Trail Unit 3
- 408 Eagle Ridge Trail
- 410 Eagle Ridge Trail
- 309 Eagle Ridge Place
- 301 Eagle Ridge Place Unit 3
- 201 Eagle Ridge Ln
- 409 Eagle Ridge Trail
- 412 Eagle Ridge Trail Unit 3
- 123 Eagle Ridge Dr
- 203 Eagle Ridge Ln Unit 2
- 311 Eagle Ridge Place Unit 3
- 310 Eagle Ridge Place
- 308 Eagle Ridge Place Unit 3
- 306 Eagle Ridge Place Unit 3
- 416 Eagle Ridge Trail
- 312 Eagle Ridge Place
- 205 Eagle Ridge Ln
Your Personal Tour Guide
Ask me questions while you tour the home.