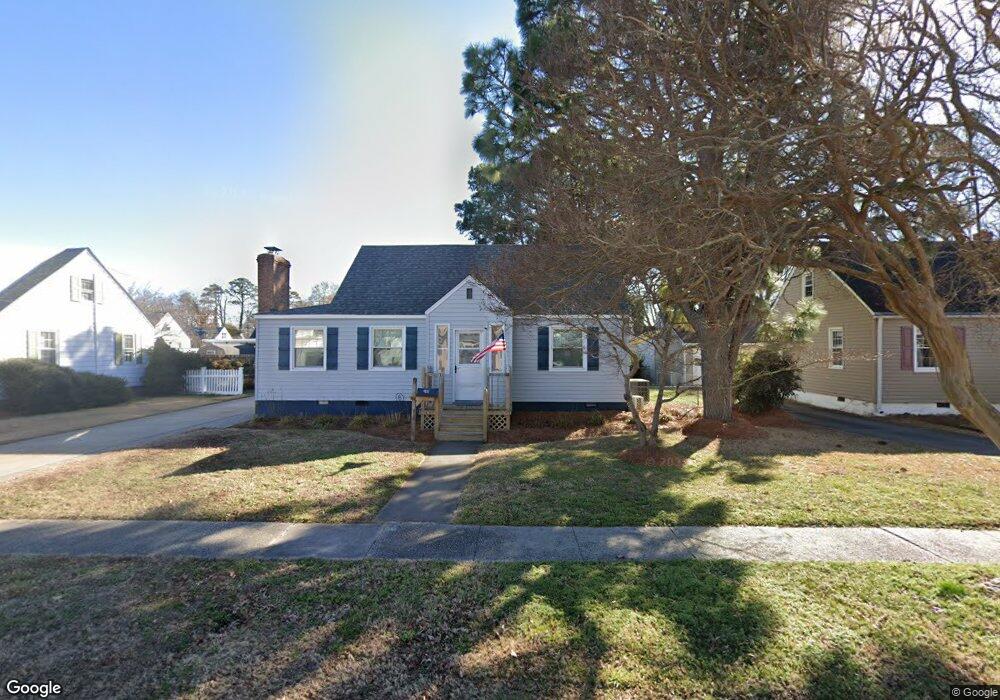
405 Farrell St Norfolk, VA 23503
Northside NeighborhoodEstimated Value: $294,000 - $342,000
3
Beds
2
Baths
1,528
Sq Ft
$214/Sq Ft
Est. Value
About This Home
This home is located at 405 Farrell St, Norfolk, VA 23503 and is currently estimated at $327,040, approximately $214 per square foot. 405 Farrell St is a home located in Norfolk City with nearby schools including Mary Calcott Elementary School, Northside Middle School, and Granby High School.
Ownership History
Date
Name
Owned For
Owner Type
Purchase Details
Closed on
Sep 6, 2024
Sold by
Shingledecker Star M and Hanchey Kelly E
Bought by
Buck Victoria
Current Estimated Value
Home Financials for this Owner
Home Financials are based on the most recent Mortgage that was taken out on this home.
Original Mortgage
$337,095
Outstanding Balance
$332,320
Interest Rate
6.47%
Mortgage Type
VA
Estimated Equity
-$5,280
Create a Home Valuation Report for This Property
The Home Valuation Report is an in-depth analysis detailing your home's value as well as a comparison with similar homes in the area
Home Values in the Area
Average Home Value in this Area
Purchase History
| Date | Buyer | Sale Price | Title Company |
|---|---|---|---|
| Buck Victoria | $330,000 | First American Title |
Source: Public Records
Mortgage History
| Date | Status | Borrower | Loan Amount |
|---|---|---|---|
| Open | Buck Victoria | $337,095 |
Source: Public Records
Tax History
| Year | Tax Paid | Tax Assessment Tax Assessment Total Assessment is a certain percentage of the fair market value that is determined by local assessors to be the total taxable value of land and additions on the property. | Land | Improvement |
|---|---|---|---|---|
| 2025 | $4,019 | $321,500 | $78,500 | $243,000 |
| 2024 | $2,385 | $190,800 | $78,500 | $112,300 |
| 2023 | $2,318 | $185,400 | $78,500 | $106,900 |
| 2022 | $2,199 | $175,900 | $69,900 | $106,000 |
| 2021 | $2,050 | $164,000 | $63,500 | $100,500 |
| 2020 | $1,901 | $152,100 | $55,000 | $97,100 |
| 2019 | $1,839 | $147,100 | $50,000 | $97,100 |
| 2018 | $1,736 | $138,900 | $50,000 | $88,900 |
| 2017 | $1,573 | $136,800 | $50,000 | $86,800 |
| 2016 | $1,573 | $139,700 | $50,000 | $89,700 |
| 2015 | $1,607 | $139,700 | $50,000 | $89,700 |
| 2014 | $1,607 | $139,700 | $50,000 | $89,700 |
Source: Public Records
Map
Nearby Homes
- 8718 Tidewater Dr
- 409 E Westmont Ave
- 318 E Westmont Ave
- 8717 Tidewater Dr
- 319 Winshire St
- 227 Farrell St
- 8704 Tidewater Dr
- 228 E Westmont Ave
- 245 Winshire St
- 511 Dune St
- 515 Earl St
- 121 E Chester St
- 117 E Chester St
- 339 E Gilpin Ave
- 505 Lenox Ave
- 110 E Bay Ave
- 9136 Ocella Ave
- 8550 Tidewater Dr Unit A1
- 700 Creamer Rd
- 8723 Chesapeake Blvd
- 405 Farrell St Unit C
- 405 Farrell St Unit B
- 405 Farrell St Unit A
- 407 Farrell St
- 403 Farrell St
- 406 Beck St
- 404 Beck St
- 408 Beck St
- 409 Farrell St
- 406 Farrell St
- 404 Farrell St
- 8812 Tidewater Dr
- 8810 Tidewater Dr
- 410 Beck St
- 408 Farrell St
- 402 Farrell St
- 8808 Tidewater Dr
- 411 Farrell St
- 410 Farrell St
- 412 Beck St
Your Personal Tour Guide
Ask me questions while you tour the home.