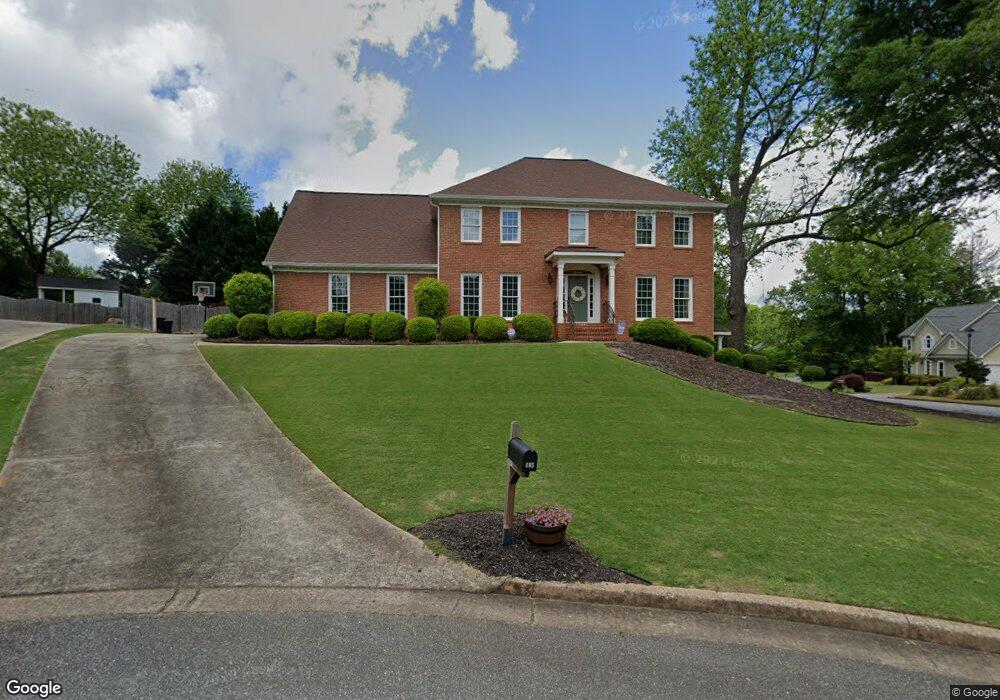
405 Gatehouse Ct Alpharetta, GA 30009
Estimated Value: $693,000 - $838,000
4
Beds
4
Baths
2,572
Sq Ft
$297/Sq Ft
Est. Value
About This Home
This home is located at 405 Gatehouse Ct, Alpharetta, GA 30009 and is currently estimated at $763,815, approximately $296 per square foot. 405 Gatehouse Ct is a home located in Fulton County with nearby schools including Alpharetta Elementary School, Northwestern Middle School, and Milton High School.
Ownership History
Date
Name
Owned For
Owner Type
Purchase Details
Closed on
Mar 1, 2017
Sold by
Venkataraman Balaji
Bought by
Harrison Brandon and Harrison Kimberly
Current Estimated Value
Home Financials for this Owner
Home Financials are based on the most recent Mortgage that was taken out on this home.
Original Mortgage
$363,750
Outstanding Balance
$301,809
Interest Rate
4.19%
Mortgage Type
New Conventional
Estimated Equity
$462,006
Purchase Details
Closed on
Oct 28, 2002
Sold by
Venkataraman Balaji
Bought by
Venkataraman Balaji and Venkataraman Veena
Purchase Details
Closed on
Oct 1, 2001
Sold by
Venturaman Balaja
Bought by
Venkataraman Balaji and Venkataraman Veena B
Home Financials for this Owner
Home Financials are based on the most recent Mortgage that was taken out on this home.
Original Mortgage
$211,200
Interest Rate
6.89%
Mortgage Type
New Conventional
Purchase Details
Closed on
Aug 28, 2000
Sold by
Todd William T
Bought by
Todd Dona H
Create a Home Valuation Report for This Property
The Home Valuation Report is an in-depth analysis detailing your home's value as well as a comparison with similar homes in the area
Home Values in the Area
Average Home Value in this Area
Purchase History
| Date | Buyer | Sale Price | Title Company |
|---|---|---|---|
| Harrison Brandon | $375,000 | -- | |
| Venkataraman Balaji | -- | -- | |
| Venkataraman Balaji | -- | -- | |
| Vnekataraman Balaji | $264,000 | -- | |
| Todd Dona H | -- | -- |
Source: Public Records
Mortgage History
| Date | Status | Borrower | Loan Amount |
|---|---|---|---|
| Open | Harrison Brandon | $363,750 | |
| Previous Owner | Vnekataraman Balaji | $211,200 |
Source: Public Records
Tax History Compared to Growth
Tax History
| Year | Tax Paid | Tax Assessment Tax Assessment Total Assessment is a certain percentage of the fair market value that is determined by local assessors to be the total taxable value of land and additions on the property. | Land | Improvement |
|---|---|---|---|---|
| 2025 | $731 | $256,520 | $71,480 | $185,040 |
| 2023 | $6,246 | $221,280 | $57,760 | $163,520 |
| 2022 | $3,505 | $210,280 | $34,320 | $175,960 |
| 2021 | $4,101 | $172,120 | $28,200 | $143,920 |
| 2020 | $4,126 | $172,120 | $28,200 | $143,920 |
| 2019 | $602 | $172,120 | $28,200 | $143,920 |
| 2018 | $3,700 | $150,000 | $37,120 | $112,880 |
| 2017 | $3,826 | $131,120 | $30,200 | $100,920 |
| 2016 | $3,826 | $131,120 | $30,200 | $100,920 |
| 2015 | $4,596 | $131,120 | $30,200 | $100,920 |
| 2014 | $2,720 | $88,720 | $24,120 | $64,600 |
Source: Public Records
Map
Nearby Homes
- 116 Emily Ln
- 1510 Shade Tree Way
- 170 Michaela Dr
- 1530 Rucker Rd
- 1413 Bellsmith Dr
- 1386 Bellsmith Dr
- 160 Watermill Falls
- 1110 Upper Hembree Rd
- 1614 Rucker Rd
- 165 Foe Creek Ct
- 1395 Mid Broadwell Rd
- 3052 Steeplechase
- 3058 Steeplechase Unit 4
- 910 Reece Rd
- 3018 Steeplechase
- 3016 Steeplechase Unit 3
- 1500 Mid Broadwell Rd
- 0 Gatehouse Ct Unit 8202522
- 0 Gatehouse Ct Unit 8829236
- 415 Gatehouse Ct
- 2160 Fairfax Dr
- 300 Julep Ct
- 2155 Fairfax Dr
- 410 Gatehouse Ct
- 2165 Fairfax Dr
- 400 Gatehouse Ct
- 310 Julep Ct
- 0 Julep Ct Unit 7362315
- 0 Julep Ct Unit 8728402
- 2145 Fairfax Dr
- 2100 Fairfax Dr
- 2135 Fairfax Dr
- 501 Veranda Ct
- 320 Julep Ct
- 735 Paddock Ct
- 0 Paddock Ct Unit 7223080
- 0 Paddock Ct