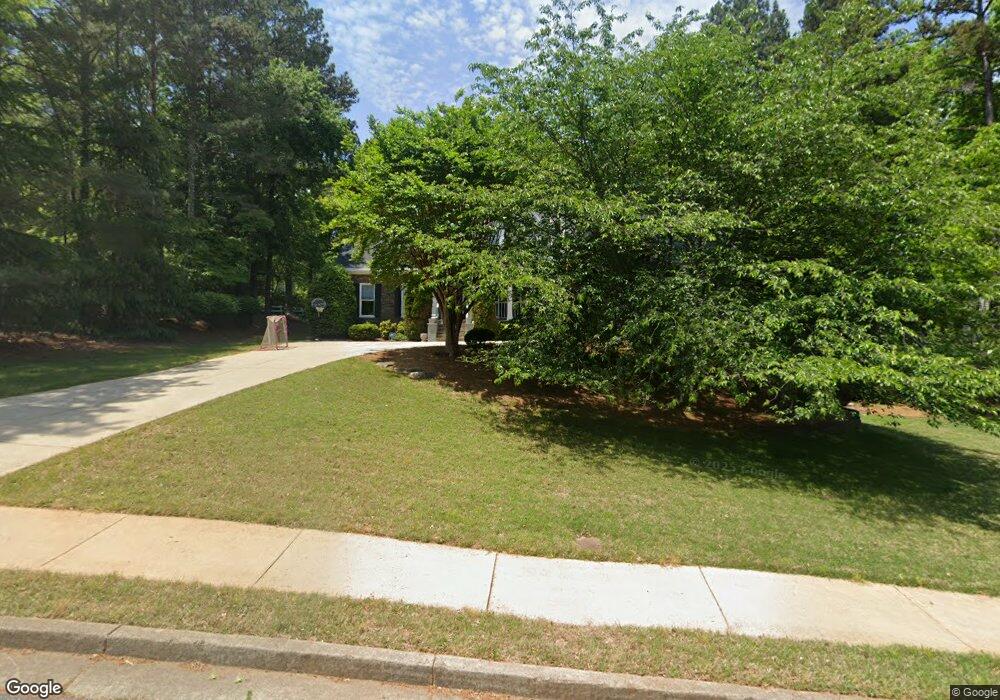
405 Highland Gate Cir Suwanee, GA 30024
Estimated Value: $695,230 - $786,000
4
Beds
4
Baths
3,031
Sq Ft
$246/Sq Ft
Est. Value
About This Home
This home is located at 405 Highland Gate Cir, Suwanee, GA 30024 and is currently estimated at $746,558, approximately $246 per square foot. 405 Highland Gate Cir is a home located in Gwinnett County with nearby schools including Riverside Elementary School, North Gwinnett Middle School, and North Gwinnett High School.
Ownership History
Date
Name
Owned For
Owner Type
Purchase Details
Closed on
Jun 11, 2010
Sold by
Unander Peggy S
Bought by
Shelley Jonathan T and Shelley Amanda C
Current Estimated Value
Home Financials for this Owner
Home Financials are based on the most recent Mortgage that was taken out on this home.
Original Mortgage
$281,213
Outstanding Balance
$186,087
Interest Rate
4.87%
Mortgage Type
FHA
Estimated Equity
$560,471
Purchase Details
Closed on
Mar 16, 2001
Sold by
Cone Jo-Ann U
Bought by
Unander Peggy Sue
Home Financials for this Owner
Home Financials are based on the most recent Mortgage that was taken out on this home.
Original Mortgage
$234,000
Interest Rate
6.6%
Mortgage Type
New Conventional
Purchase Details
Closed on
Nov 30, 1995
Sold by
Southwind Inc
Bought by
Vnander Peggy Sue Robert
Create a Home Valuation Report for This Property
The Home Valuation Report is an in-depth analysis detailing your home's value as well as a comparison with similar homes in the area
Home Values in the Area
Average Home Value in this Area
Purchase History
| Date | Buyer | Sale Price | Title Company |
|---|---|---|---|
| Shelley Jonathan T | $285,000 | -- | |
| Unander Peggy Sue | -- | -- | |
| Unander Peggy Sue | -- | -- | |
| Vnander Peggy Sue Robert | $245,000 | -- |
Source: Public Records
Mortgage History
| Date | Status | Borrower | Loan Amount |
|---|---|---|---|
| Open | Shelley Jonathan T | $281,213 | |
| Previous Owner | Unander Peggy Sue | $234,000 | |
| Closed | Vnander Peggy Sue Robert | $0 |
Source: Public Records
Tax History
| Year | Tax Paid | Tax Assessment Tax Assessment Total Assessment is a certain percentage of the fair market value that is determined by local assessors to be the total taxable value of land and additions on the property. | Land | Improvement |
|---|---|---|---|---|
| 2025 | $8,290 | $311,760 | $44,080 | $267,680 |
| 2024 | $8,036 | $289,760 | $46,000 | $243,760 |
| 2023 | $8,036 | $263,320 | $43,600 | $219,720 |
| 2022 | $6,680 | $225,240 | $43,600 | $181,640 |
| 2021 | $5,844 | $180,000 | $36,000 | $144,000 |
| 2020 | $5,887 | $180,000 | $36,000 | $144,000 |
| 2019 | $5,722 | $180,000 | $36,000 | $144,000 |
| 2018 | $5,038 | $150,800 | $36,000 | $114,800 |
| 2016 | $5,060 | $150,800 | $36,000 | $114,800 |
| 2015 | $4,574 | $126,120 | $27,200 | $98,920 |
| 2014 | $4,249 | $114,760 | $23,600 | $91,160 |
Source: Public Records
Map
Nearby Homes
- 0 Johnson Rd Unit 7677593
- 0 Johnson Rd Unit 10638841
- 0 Johnson Rd Unit CL344832
- 510 Running Fawn Dr
- 585 Settles Brook Ct
- 487 Skiles Ct
- 5165 Amberden Hall Dr Unit 5
- 5385 Harbury Ln
- 5649 Kennedy Rd
- 412 Antler Ln
- 972 Harvest Park Ln
- 731 Hexham Ct
- 5742 Ashleigh Walk Dr
- 5775 Kennedy Rd
- 5755 Kennedy Rd
- 5157 Wellisford Ct Unit 8
- 100 Hawnley Trace
- 120 Hawnley Trace
- 600 Grimsby Ct
- 5224 Brendlynn Dr
- 395 Highland Gate Cir
- 0 Highland Gate Cir Unit 8824450
- 400 Highland Gate Cir
- 385 Highland Gate Cir Unit 2
- 390 Highland Gate Cir
- 5410 Highland Gate Dr Unit 1
- 375 Highland Gate Cir
- 380 Highland Gate Cir Unit 2
- 5405 Highland Gate Dr
- 5400 Highland Gate Dr Unit 1
- 365 Highland Gate Cir Unit 2
- 5454 Culzean Way
- 370 Highland Gate Cir Unit 2
- 5395 Highland Gate Dr
- 5390 Highland Gate Dr
- 5459 Culzean Way
- 420 Highland Gate Cir
- 355 Highland Gate Cir Unit 47
- 355 Highland Gate Cir
- 360 Highland Gate Cir Unit 2
Your Personal Tour Guide
Ask me questions while you tour the home.