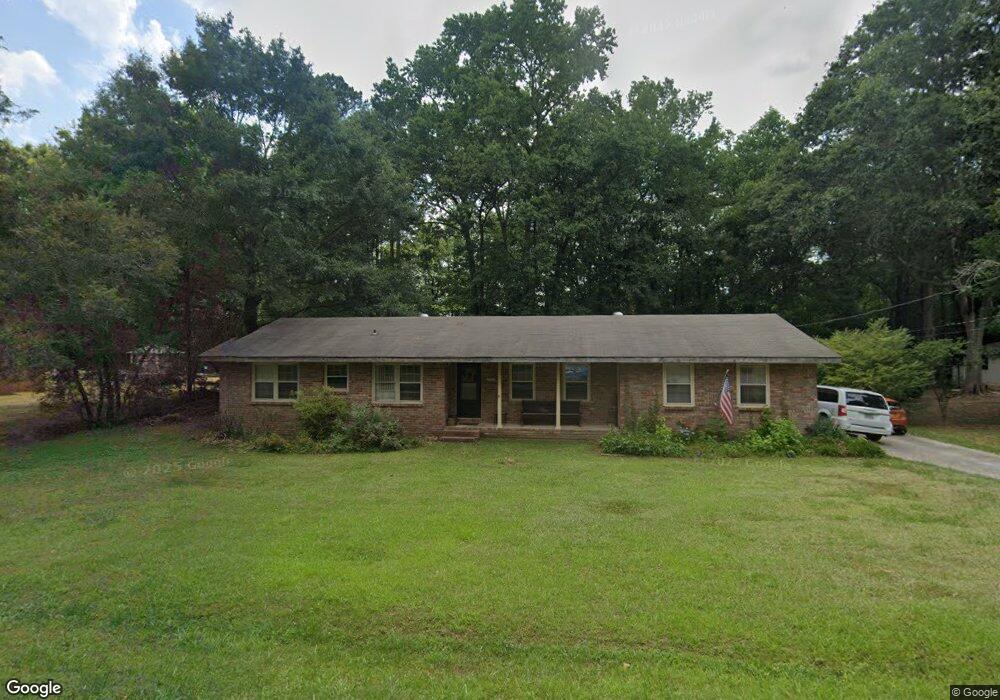
405 Hilltop Rd SW Conyers, GA 30094
Estimated Value: $220,749 - $264,000
4
Beds
2
Baths
1,517
Sq Ft
$159/Sq Ft
Est. Value
About This Home
This home is located at 405 Hilltop Rd SW, Conyers, GA 30094 and is currently estimated at $241,187, approximately $158 per square foot. 405 Hilltop Rd SW is a home located in Rockdale County with nearby schools including Shoal Creek Elementary School, Gen. Ray Davis Middle School, and Heritage High School.
Ownership History
Date
Name
Owned For
Owner Type
Purchase Details
Closed on
Oct 17, 2007
Sold by
Kdae Investments Inc
Bought by
Allen Herbert N and Allen Ninnah E
Current Estimated Value
Home Financials for this Owner
Home Financials are based on the most recent Mortgage that was taken out on this home.
Original Mortgage
$112,770
Outstanding Balance
$70,989
Interest Rate
6.37%
Mortgage Type
Trade
Estimated Equity
$170,198
Purchase Details
Closed on
Jul 27, 2007
Sold by
Lenett Thomas W
Bought by
Kdae Investments Inc
Home Financials for this Owner
Home Financials are based on the most recent Mortgage that was taken out on this home.
Original Mortgage
$93,750
Interest Rate
6.65%
Purchase Details
Closed on
Dec 29, 2000
Sold by
Lenett Mary G
Bought by
Lenett Thomas W
Home Financials for this Owner
Home Financials are based on the most recent Mortgage that was taken out on this home.
Original Mortgage
$60,000
Interest Rate
7.65%
Mortgage Type
New Conventional
Create a Home Valuation Report for This Property
The Home Valuation Report is an in-depth analysis detailing your home's value as well as a comparison with similar homes in the area
Home Values in the Area
Average Home Value in this Area
Purchase History
| Date | Buyer | Sale Price | Title Company |
|---|---|---|---|
| Allen Herbert N | $140,000 | -- | |
| Kdae Investments Inc | $100,000 | -- | |
| Lenett Thomas W | $80,000 | -- |
Source: Public Records
Mortgage History
| Date | Status | Borrower | Loan Amount |
|---|---|---|---|
| Open | Allen Herbert N | $112,770 | |
| Previous Owner | Kdae Investments Inc | $93,750 | |
| Previous Owner | Lenett Thomas W | $60,000 |
Source: Public Records
Tax History Compared to Growth
Tax History
| Year | Tax Paid | Tax Assessment Tax Assessment Total Assessment is a certain percentage of the fair market value that is determined by local assessors to be the total taxable value of land and additions on the property. | Land | Improvement |
|---|---|---|---|---|
| 2024 | $1,551 | $68,400 | $17,680 | $50,720 |
| 2023 | $1,610 | $72,600 | $17,400 | $55,200 |
| 2022 | $1,501 | $68,360 | $22,400 | $45,960 |
| 2021 | $1,114 | $50,880 | $11,080 | $39,800 |
| 2020 | $873 | $43,520 | $8,000 | $35,520 |
| 2019 | $802 | $40,520 | $7,360 | $33,160 |
| 2018 | $459 | $29,280 | $4,400 | $24,880 |
| 2017 | $376 | $26,440 | $4,800 | $21,640 |
| 2016 | $348 | $26,440 | $4,800 | $21,640 |
| 2015 | $289 | $24,360 | $3,760 | $20,600 |
| 2014 | $1,224 | $26,200 | $5,160 | $21,040 |
| 2013 | -- | $32,760 | $8,400 | $24,360 |
Source: Public Records
Map
Nearby Homes
- 423 Center Cir SW
- 464 Abbott Rd SW
- 318 Cedar Hollow Dr
- 2833 Abbott Lake Rd SW
- 8097 White Oak Loop
- 283 Abbotts Crossing Cir
- 178 Abbotts Crossing Cir
- 200 Abbotts Crossing Cir
- 198 Abbotts Crossing Cir
- 275 Abbotts Crossing Cir
- 198 Abbott Crossing Cir
- 267 Abbotts Crossing Cir
- 180 Abbotts Crossing Cir
- 279 Abbotts Crossing Cir
- 273 Abbotts Crossing Cir
- 273 Abbott Crossing Cir
- 275 Abbott Crossing Cir
- 271 Abbotts Crossing Cir
- 265 Abbotts Crossing Cir
- 415 Hilltop Rd SW
- 393 Hilltop Rd SW
- 406 Hilltop Rd SW
- 429 Hilltop Rd SW
- 2708 N Lakeview Dr SW
- 418 Hilltop Rd SW
- 2691 N Lakeview Dr SW
- N N Lakeview Dr SW Unit TR2
- N N Lakeview Dr SW
- 2676 N Lakeview Dr SW
- 441 Hilltop Rd SW
- 2711 N Lakeview Dr SW
- 2699 N Lakeview Dr SW
- 435 Center Cir SW
- 442 Hilltop Rd SW
- 2725 N Lakeview Dr SW
- 2685 N Lakeview Dr SW
- 2662 N Lakeview Dr SW
- 453 Hilltop Rd SW
- 0 Center Cir Unit 8825658