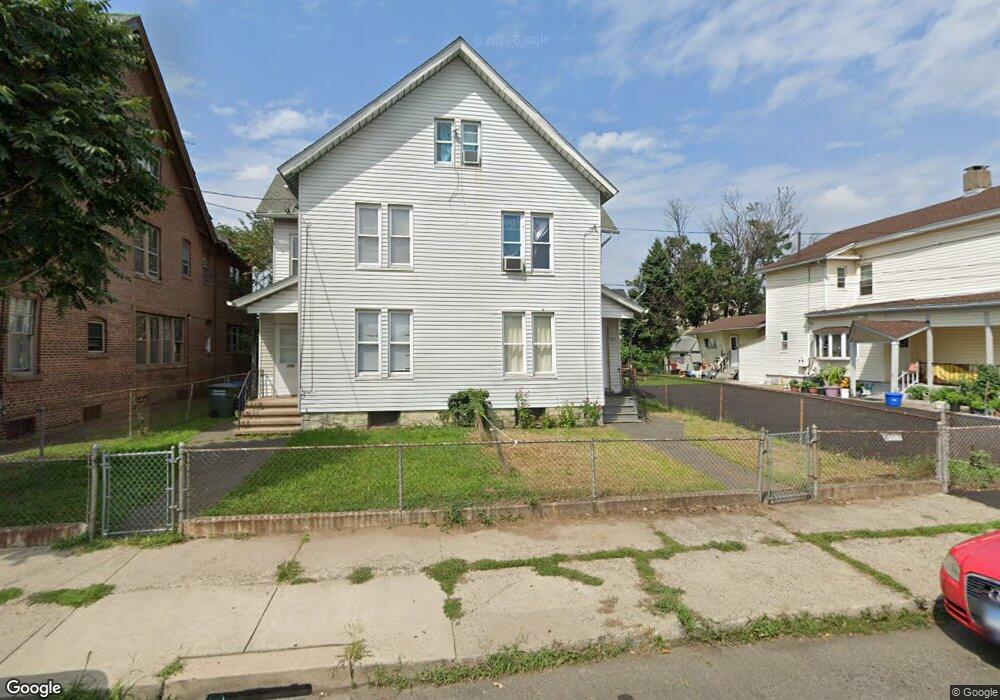
405 Jane St Unit 1 Bridgeport, CT 06608
East Side Bridgeport NeighborhoodEstimated Value: $276,000 - $321,000
4
Beds
1
Bath
1,659
Sq Ft
$180/Sq Ft
Est. Value
About This Home
This home is located at 405 Jane St Unit 1, Bridgeport, CT 06608 and is currently estimated at $299,096, approximately $180 per square foot. 405 Jane St Unit 1 is a home located in Fairfield County with nearby schools including Barnum School, Harding High School, and Achievement First Bridgeport Academy Elementary School.
Ownership History
Date
Name
Owned For
Owner Type
Purchase Details
Closed on
Nov 30, 2023
Sold by
K & K Homes Llc
Bought by
Augustave Paul
Current Estimated Value
Home Financials for this Owner
Home Financials are based on the most recent Mortgage that was taken out on this home.
Original Mortgage
$232,370
Outstanding Balance
$228,274
Interest Rate
7.63%
Mortgage Type
Purchase Money Mortgage
Estimated Equity
$70,822
Purchase Details
Closed on
May 31, 2018
Sold by
Wc Mcbride Realty Mgmt
Bought by
K & K Homes Llc
Purchase Details
Closed on
Mar 11, 2013
Sold by
Rivera Alfonso
Bought by
Mcbride Willie
Home Financials for this Owner
Home Financials are based on the most recent Mortgage that was taken out on this home.
Original Mortgage
$112,917
Interest Rate
3.45%
Mortgage Type
New Conventional
Purchase Details
Closed on
Sep 12, 2012
Sold by
Mcbride Willie
Bought by
W C Mcbride Rlty Mgmt
Create a Home Valuation Report for This Property
The Home Valuation Report is an in-depth analysis detailing your home's value as well as a comparison with similar homes in the area
Home Values in the Area
Average Home Value in this Area
Purchase History
| Date | Buyer | Sale Price | Title Company |
|---|---|---|---|
| Augustave Paul | $244,600 | None Available | |
| Augustave Paul | $244,600 | None Available | |
| K & K Homes Llc | $20,000 | -- | |
| K & K Homes Llc | $20,000 | -- | |
| Mcbride Willie | $115,000 | -- | |
| Mcbride Willie | $115,000 | -- | |
| W C Mcbride Rlty Mgmt | -- | -- | |
| W C Mcbride Rlty Mgmt | -- | -- |
Source: Public Records
Mortgage History
| Date | Status | Borrower | Loan Amount |
|---|---|---|---|
| Open | Augustave Paul | $232,370 | |
| Closed | Augustave Paul | $232,370 | |
| Previous Owner | W C Mcbride Rlty Mgmt | $112,917 |
Source: Public Records
Tax History Compared to Growth
Tax History
| Year | Tax Paid | Tax Assessment Tax Assessment Total Assessment is a certain percentage of the fair market value that is determined by local assessors to be the total taxable value of land and additions on the property. | Land | Improvement |
|---|---|---|---|---|
| 2025 | $5,630 | $129,574 | $19,494 | $110,080 |
| 2024 | $4,486 | $103,234 | $19,494 | $83,740 |
| 2023 | $4,486 | $103,234 | $19,494 | $83,740 |
| 2022 | $4,486 | $103,234 | $19,494 | $83,740 |
| 2021 | $4,486 | $103,234 | $19,494 | $83,740 |
| 2020 | $3,175 | $58,800 | $4,620 | $54,180 |
| 2019 | $3,175 | $58,800 | $4,620 | $54,180 |
| 2018 | $3,197 | $58,800 | $4,620 | $54,180 |
| 2017 | $3,197 | $58,800 | $4,620 | $54,180 |
| 2016 | $3,197 | $58,800 | $4,620 | $54,180 |
| 2015 | $3,423 | $81,110 | $8,940 | $72,170 |
| 2014 | $3,423 | $81,110 | $8,940 | $72,170 |
Source: Public Records
Map
Nearby Homes
- 405 Jane St
- 415 Jane St
- 426 Jane St Unit 428
- 426 Jane St Unit 1st Floor
- 600 Shelton St
- 600 Shelton St Unit 1
- 431 Jane St
- 420 Jane St Unit 422
- 592 Shelton St
- 425 Jane St
- 570 Shelton St
- 612 Shelton St
- 612 Shelton St Unit 1
- 562 Shelton St
- 1167 Pembroke St
- 1171 Pembroke St Unit 2L
- 595 Shelton St
- 556 Shelton St
- 556 Shelton St Unit 3
- 556 Shelton St Unit 1