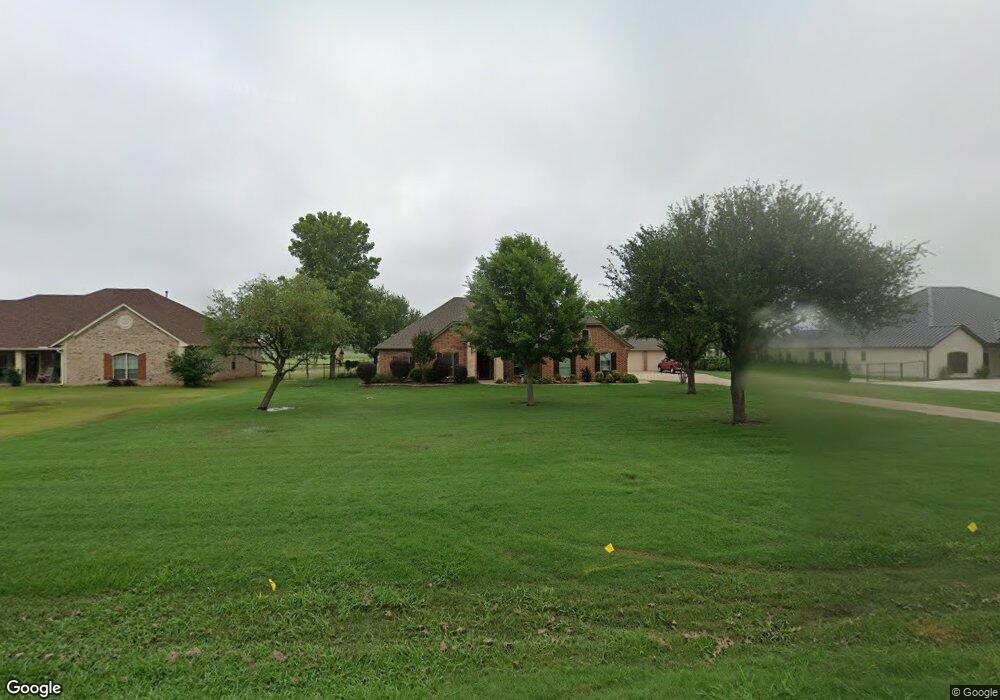
405 Jayme Ct Burleson, TX 76028
Osage-North Fisk NeighborhoodEstimated Value: $469,000 - $646,000
4
Beds
3
Baths
2,340
Sq Ft
$228/Sq Ft
Est. Value
About This Home
This home is located at 405 Jayme Ct, Burleson, TX 76028 and is currently estimated at $533,914, approximately $228 per square foot. 405 Jayme Ct is a home located in Johnson County with nearby schools including Irene Clinkscale Elementary School, Nick Kerr Middle School, and Burleson Centennial High School.
Ownership History
Date
Name
Owned For
Owner Type
Purchase Details
Closed on
Feb 15, 2013
Sold by
Weaver Russell T
Bought by
Weaver Russell T and Weaver Angela L
Current Estimated Value
Home Financials for this Owner
Home Financials are based on the most recent Mortgage that was taken out on this home.
Original Mortgage
$195,850
Outstanding Balance
$38,747
Interest Rate
3.44%
Mortgage Type
New Conventional
Estimated Equity
$495,167
Purchase Details
Closed on
Jun 29, 2005
Sold by
Henson Randy and Henson Salana
Bought by
Weaver Russell T
Home Financials for this Owner
Home Financials are based on the most recent Mortgage that was taken out on this home.
Original Mortgage
$183,200
Interest Rate
5.64%
Mortgage Type
New Conventional
Create a Home Valuation Report for This Property
The Home Valuation Report is an in-depth analysis detailing your home's value as well as a comparison with similar homes in the area
Home Values in the Area
Average Home Value in this Area
Purchase History
| Date | Buyer | Sale Price | Title Company |
|---|---|---|---|
| Weaver Russell T | -- | Fidelity National Title Agen | |
| Weaver Russell T | -- | None Available |
Source: Public Records
Mortgage History
| Date | Status | Borrower | Loan Amount |
|---|---|---|---|
| Open | Weaver Russell T | $195,850 | |
| Closed | Weaver Russell T | $183,200 |
Source: Public Records
Tax History Compared to Growth
Tax History
| Year | Tax Paid | Tax Assessment Tax Assessment Total Assessment is a certain percentage of the fair market value that is determined by local assessors to be the total taxable value of land and additions on the property. | Land | Improvement |
|---|---|---|---|---|
| 2025 | $6,301 | $451,915 | $134,616 | $317,299 |
| 2024 | $7,646 | $451,915 | $134,616 | $317,299 |
| 2023 | $5,944 | $451,915 | $134,616 | $317,299 |
| 2022 | $7,456 | $451,915 | $134,616 | $317,299 |
| 2021 | $6,978 | $422,910 | $134,616 | $288,294 |
| 2020 | $6,597 | $321,281 | $98,592 | $222,689 |
| 2019 | $7,075 | $321,281 | $98,592 | $222,689 |
| 2018 | $6,626 | $300,904 | $64,464 | $236,440 |
| 2017 | $6,198 | $300,904 | $64,464 | $236,440 |
| 2016 | $5,854 | $284,226 | $56,880 | $227,346 |
| 2015 | $5,322 | $284,226 | $56,880 | $227,346 |
| 2014 | $5,322 | $272,850 | $45,504 | $227,346 |
Source: Public Records
Map
Nearby Homes
- 1668 Cedar Elm Way
- 1660 Cedar Elm Way
- 1656 Cedar Elm Way
- 316 Diamond Ln
- 1652 Sequoia Way
- 3817 Cross Timber Rd
- 309 Loretta Ln
- 1345 Broad Valley Ct
- 1328 Cash St
- 312 Lovett Ln
- Brentwood 3F (w/Media) Plan at High Country
- Broadcrest FSW Plan at High Country
- Eagle 2FS (w/Media) Plan at High Country
- Caroline 2F Plan at High Country
- McKinnon Plan at High Country
- Stonebriar 2FSW (w/Media) Plan at High Country
- Coventry 2F Plan at High Country
- Hillcrest 2F (w/Media) Plan at High Country
- Northcrest 3FSW (w/Media) Plan at High Country
- Brentwood 3FSW (w/Media) Plan at High Country