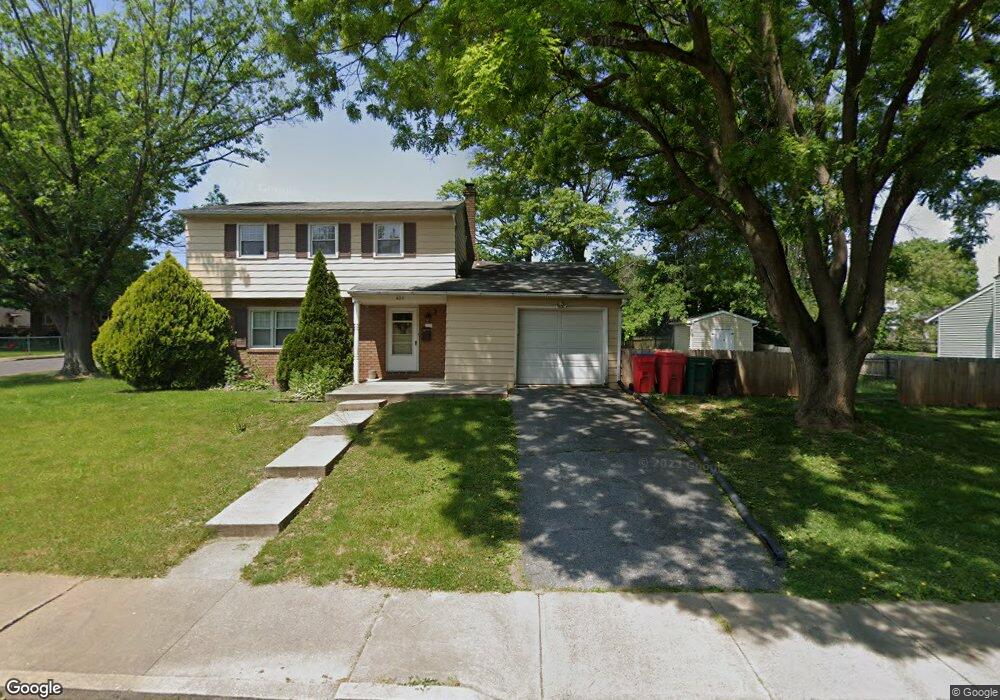
405 Lemon St Pottstown, PA 19464
Estimated Value: $310,000 - $350,000
3
Beds
2
Baths
1,404
Sq Ft
$230/Sq Ft
Est. Value
About This Home
This home is located at 405 Lemon St, Pottstown, PA 19464 and is currently estimated at $322,428, approximately $229 per square foot. 405 Lemon St is a home located in Montgomery County with nearby schools including Lower Pottsgrove Elementary School, Pottsgrove Middle School, and Pottsgrove Senior High School.
Ownership History
Date
Name
Owned For
Owner Type
Purchase Details
Closed on
Sep 25, 2006
Sold by
Smith Brian J
Bought by
Smith Brian J and Smith Margherita A
Current Estimated Value
Home Financials for this Owner
Home Financials are based on the most recent Mortgage that was taken out on this home.
Original Mortgage
$166,460
Outstanding Balance
$99,256
Interest Rate
6.54%
Estimated Equity
$223,172
Purchase Details
Closed on
Feb 24, 2004
Sold by
Haraczka John P and Haraczka Lori A
Bought by
Smith Brian J
Home Financials for this Owner
Home Financials are based on the most recent Mortgage that was taken out on this home.
Original Mortgage
$120,000
Interest Rate
5.67%
Purchase Details
Closed on
May 31, 1996
Sold by
Gofus Raymond D and Lynette Gofus J
Bought by
Haraczka John P and Haraczka Lori A
Create a Home Valuation Report for This Property
The Home Valuation Report is an in-depth analysis detailing your home's value as well as a comparison with similar homes in the area
Home Values in the Area
Average Home Value in this Area
Purchase History
| Date | Buyer | Sale Price | Title Company |
|---|---|---|---|
| Smith Brian J | -- | None Available | |
| Smith Brian J | $160,000 | -- | |
| Haraczka John P | $120,000 | -- |
Source: Public Records
Mortgage History
| Date | Status | Borrower | Loan Amount |
|---|---|---|---|
| Open | Smith Brian J | $166,460 | |
| Closed | Smith Brian J | $120,000 |
Source: Public Records
Tax History Compared to Growth
Tax History
| Year | Tax Paid | Tax Assessment Tax Assessment Total Assessment is a certain percentage of the fair market value that is determined by local assessors to be the total taxable value of land and additions on the property. | Land | Improvement |
|---|---|---|---|---|
| 2025 | $5,035 | $104,820 | $38,100 | $66,720 |
| 2024 | $5,035 | $104,820 | $38,100 | $66,720 |
| 2023 | $4,875 | $104,820 | $38,100 | $66,720 |
| 2022 | $4,800 | $104,820 | $38,100 | $66,720 |
| 2021 | $4,730 | $104,820 | $38,100 | $66,720 |
| 2020 | $4,659 | $104,820 | $38,100 | $66,720 |
| 2019 | $4,634 | $104,820 | $38,100 | $66,720 |
| 2018 | $4,635 | $104,820 | $38,100 | $66,720 |
| 2017 | $4,619 | $104,820 | $38,100 | $66,720 |
| 2016 | $4,578 | $104,820 | $38,100 | $66,720 |
| 2015 | $4,419 | $104,820 | $38,100 | $66,720 |
| 2014 | $4,419 | $104,820 | $38,100 | $66,720 |
Source: Public Records
Map
Nearby Homes
- 334 Lemon St
- 501 and 507 E Race St
- 530 E Howard St
- 160 Linden St Unit 69
- 703 Holly Dr
- 601 W High St
- 8 Ryan St
- 0 Ash St Unit PAMC2144590
- 536 & 538 W Vine St
- 104 Pulaski St
- 1036 Edgewood Dr
- 356 W Beech St Unit 160
- 94 Random Rd
- 25 Random Rd
- 145 Random Rd
- 150 Random Rd
- 1209 Grosstown Rd
- 86 Westin Rd
- 131 Squirrel Hollow Rd
- 377 Circle of Progress Dr
- 402 E Howard St
- 409 Lemon St
- 330 E Howard St
- 414 E Howard St
- 415 Lemon St
- 328 E Howard St
- 428 E Howard St
- 226 School Ln
- 226 School Ln
- 430 E Howard St
- 407 E Howard St
- 409 E Howard St
- 411 E Race St
- 332 Lemon St
- 320 E Howard St
- 415 E Howard St
- 328 Lemon St
- 411 Rice St
- 326 Lemon St
- 417 E Howard St Unit 36