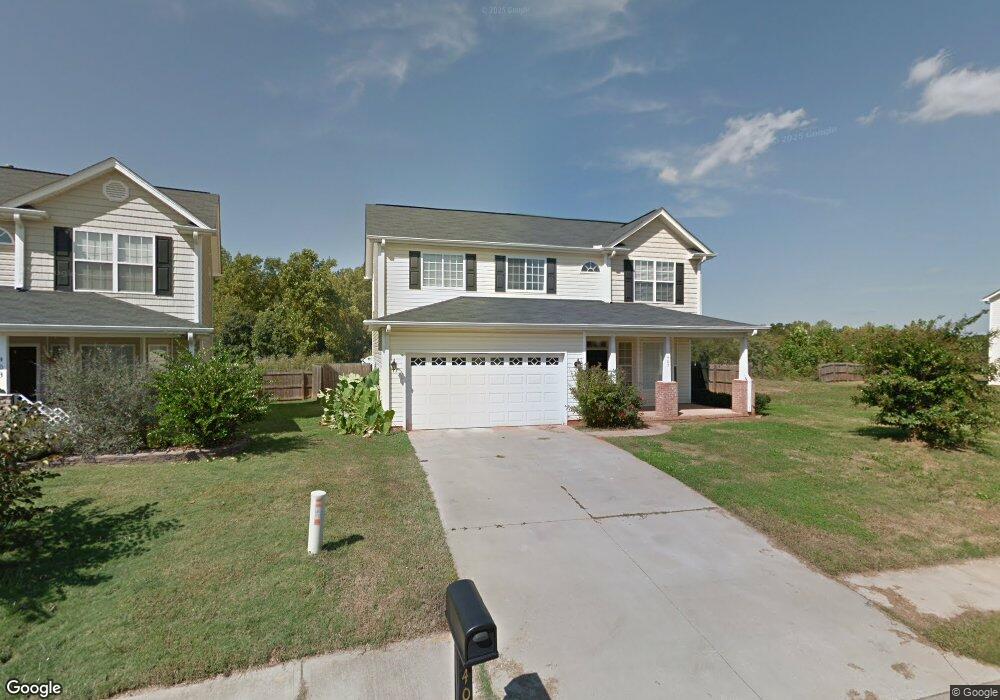
405 Melbourne Ln Spartanburg, SC 29301
Wadsworth Hills NeighborhoodEstimated Value: $271,470 - $291,000
4
Beds
3
Baths
1,936
Sq Ft
$145/Sq Ft
Est. Value
About This Home
This home is located at 405 Melbourne Ln, Spartanburg, SC 29301 and is currently estimated at $280,118, approximately $144 per square foot. 405 Melbourne Ln is a home located in Spartanburg County with nearby schools including Dorman High School Freshman Campus, Dorman High School, and Fine Arts Preparatory School.
Ownership History
Date
Name
Owned For
Owner Type
Purchase Details
Closed on
Aug 18, 2020
Sold by
Kumar Fnu Satish and Rani Asha
Bought by
Kumar Fnu Satish and Rani Asha
Current Estimated Value
Purchase Details
Closed on
Mar 23, 2015
Sold by
Winter David L and Winter Jean
Bought by
Kumar Fnu Satish and Rani Fnu Asha
Home Financials for this Owner
Home Financials are based on the most recent Mortgage that was taken out on this home.
Original Mortgage
$97,600
Outstanding Balance
$75,054
Interest Rate
3.79%
Mortgage Type
New Conventional
Estimated Equity
$205,064
Purchase Details
Closed on
Mar 16, 2007
Sold by
Sk Builders Inc
Bought by
Winter David L and Winter Jean
Home Financials for this Owner
Home Financials are based on the most recent Mortgage that was taken out on this home.
Original Mortgage
$31,710
Interest Rate
6.15%
Mortgage Type
Stand Alone Second
Create a Home Valuation Report for This Property
The Home Valuation Report is an in-depth analysis detailing your home's value as well as a comparison with similar homes in the area
Home Values in the Area
Average Home Value in this Area
Purchase History
| Date | Buyer | Sale Price | Title Company |
|---|---|---|---|
| Kumar Fnu Satish | -- | Avenue 365 Lender Services L | |
| Kumar Fnu Satish | $122,000 | -- | |
| Winter David L | $158,550 | Capital Title Agency | |
| Winter David L | $158,550 | Capital Title Agency |
Source: Public Records
Mortgage History
| Date | Status | Borrower | Loan Amount |
|---|---|---|---|
| Open | Kumar Fnu Satish | $97,600 | |
| Previous Owner | Winter David L | $31,710 | |
| Previous Owner | Winter David L | $118,912 |
Source: Public Records
Tax History Compared to Growth
Tax History
| Year | Tax Paid | Tax Assessment Tax Assessment Total Assessment is a certain percentage of the fair market value that is determined by local assessors to be the total taxable value of land and additions on the property. | Land | Improvement |
|---|---|---|---|---|
| 2025 | $2,013 | $7,641 | $994 | $6,647 |
| 2024 | $2,013 | $7,641 | $994 | $6,647 |
| 2023 | $2,013 | $7,641 | $994 | $6,647 |
| 2022 | $1,806 | $6,644 | $960 | $5,684 |
| 2021 | $1,717 | $6,270 | $906 | $5,364 |
| 2020 | $1,697 | $6,270 | $906 | $5,364 |
| 2019 | $1,697 | $6,270 | $906 | $5,364 |
| 2018 | $1,697 | $6,270 | $906 | $5,364 |
| 2017 | $1,495 | $5,452 | $960 | $4,492 |
| 2016 | $1,495 | $5,452 | $960 | $4,492 |
| 2015 | $1,482 | $5,452 | $960 | $4,492 |
| 2014 | $3,593 | $8,178 | $1,440 | $6,738 |
Source: Public Records
Map
Nearby Homes
- 409 Melbourne Ln
- 1286 Westgate Village Dr
- 1230 Westgate Village Dr
- 1294 Westgate Village Dr
- 1279 Westgate Village Dr
- 206 Collingwood Ln
- Arcadia Plan at Westgate Village Townes
- Glover Plan at Westgate Village Townes
- Raycord Plan at Westgate Village Townes
- Clifton Plan at Westgate Village Townes
- Ivey Plan at Westgate Village Townes
- 1596 Bayridge Rd
- 0 W Blackstock Rd Unit Morning Circle
- 0 W Blackstock Rd
- 114 Milo Rd
- 208 Saint Matthews Ln
- 1460 Dover Rd Unit A
- 2312 Mill Loop
- 2321 Mill Loop
- 2353 Mill Loop
- 407 Melbourne Ln
- 403 Melbourne Ln
- 110 Brisbane Way
- 404 Melbourne Ln
- 402 Melbourne Ln
- 406 Melbourne Ln
- 411 Melbourne Ln
- 400 Melbourne Ln
- 413 Melbourne Ln
- 410 Melbourne Ln
- 603 Adelaide Dr
- 605 Adelaide Dr
- 601 Adelaide Dr
- 415 Melbourne Ln
- 607 Adelaide Dr
- 412 Melbourne Ln
- 107 Brisbane Way
- 105 Brisbane Way
- 109 Brisbane Way
- 609 Adelaide Dr