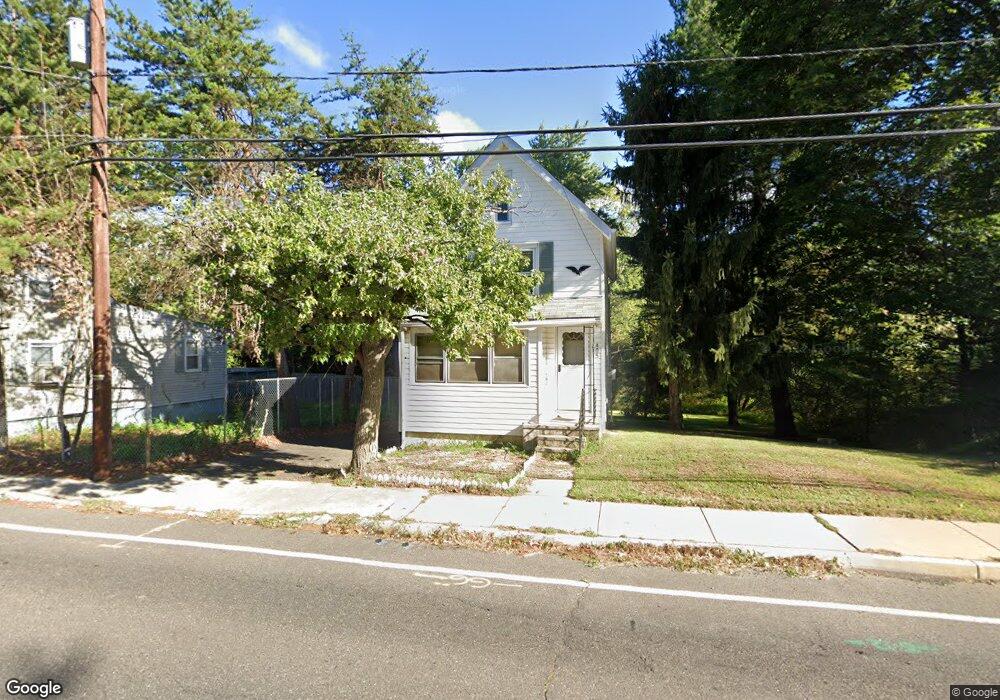
405 Mill St Mount Holly, NJ 08060
Estimated Value: $226,726 - $361,000
Studio
--
Bath
865
Sq Ft
$330/Sq Ft
Est. Value
About This Home
This home is located at 405 Mill St, Mount Holly, NJ 08060 and is currently estimated at $285,432, approximately $329 per square foot. 405 Mill St is a home located in Burlington County with nearby schools including John Brainerd Elementary School, Folwell Elementary School, and F.W. Holbein School.
Ownership History
Date
Name
Owned For
Owner Type
Purchase Details
Closed on
Oct 9, 1998
Sold by
Borden Marion E
Bought by
King Wayland T
Current Estimated Value
Home Financials for this Owner
Home Financials are based on the most recent Mortgage that was taken out on this home.
Original Mortgage
$55,900
Outstanding Balance
$12,070
Interest Rate
6.74%
Mortgage Type
FHA
Estimated Equity
$273,362
Create a Home Valuation Report for This Property
The Home Valuation Report is an in-depth analysis detailing your home's value as well as a comparison with similar homes in the area
Home Values in the Area
Average Home Value in this Area
Purchase History
| Date | Buyer | Sale Price | Title Company |
|---|---|---|---|
| King Wayland T | $56,000 | Weichert Title Agency |
Source: Public Records
Mortgage History
| Date | Status | Borrower | Loan Amount |
|---|---|---|---|
| Open | King Wayland T | $55,900 |
Source: Public Records
Tax History
| Year | Tax Paid | Tax Assessment Tax Assessment Total Assessment is a certain percentage of the fair market value that is determined by local assessors to be the total taxable value of land and additions on the property. | Land | Improvement |
|---|---|---|---|---|
| 2025 | $4,501 | $128,200 | $56,900 | $71,300 |
| 2024 | $4,302 | $128,200 | $56,900 | $71,300 |
| 2023 | $4,302 | $128,200 | $56,900 | $71,300 |
| 2022 | $4,151 | $128,200 | $56,900 | $71,300 |
| 2021 | $3,796 | $128,200 | $56,900 | $71,300 |
| 2020 | $3,924 | $128,200 | $56,900 | $71,300 |
| 2019 | $3,836 | $128,200 | $56,900 | $71,300 |
| 2018 | $3,768 | $128,200 | $56,900 | $71,300 |
| 2017 | $3,670 | $128,200 | $56,900 | $71,300 |
| 2016 | $3,586 | $128,200 | $56,900 | $71,300 |
| 2015 | $3,510 | $128,200 | $56,900 | $71,300 |
| 2014 | $3,381 | $128,200 | $56,900 | $71,300 |
Source: Public Records
Map
Nearby Homes
- 426 Merritt Dr
- 6 Kates Tract
- 178 Mill St
- 3 Buckingham Dr
- 118 Mill St Unit 120
- 156 Shreve St
- 122 Pearl St
- 118 Pearl St
- 119 Mount Holly Ave
- 19 Nottingham Way
- 5 Surrey Ct
- 124 Mount Holly Ave
- 1 Woods Aly
- 44 Buttonwood St
- 102 Shreve St
- 6 Kates
- 100 Shreve St
- 46 C Buttonwood St
- 348 Broad St
- 36 Kensington Dr
Your Personal Tour Guide
Ask me questions while you tour the home.