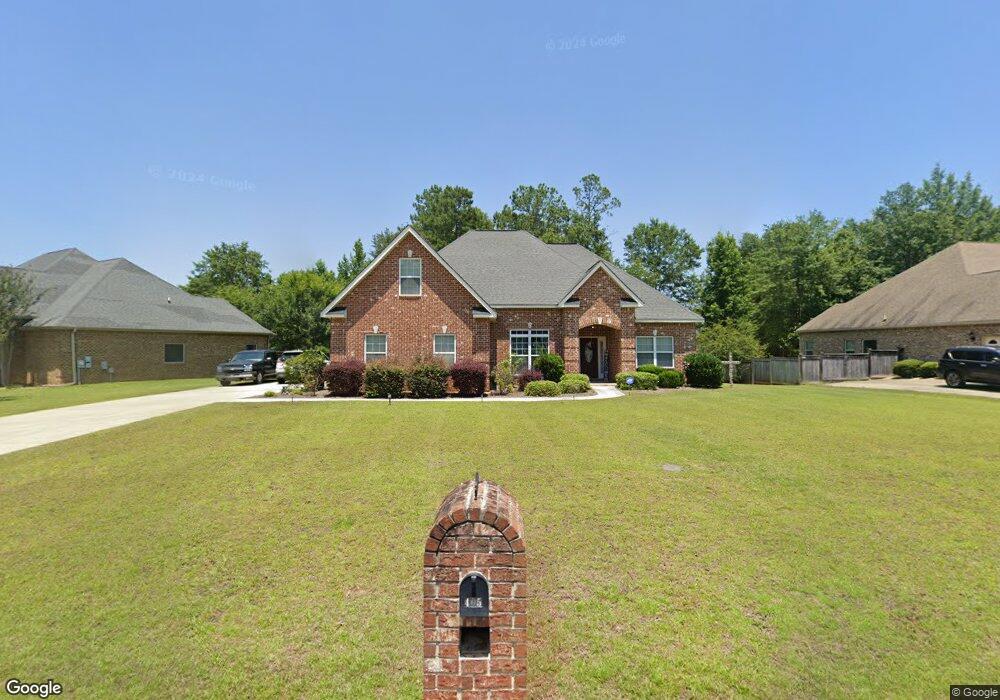
405 Morgan Ranch Cir Bonaire, GA 31005
Estimated Value: $343,933 - $394,000
4
Beds
3
Baths
2,349
Sq Ft
$159/Sq Ft
Est. Value
About This Home
This home is located at 405 Morgan Ranch Cir, Bonaire, GA 31005 and is currently estimated at $374,483, approximately $159 per square foot. 405 Morgan Ranch Cir is a home located in Houston County with nearby schools including Bonaire Elementary School, Bonaire Middle School, and Veterans High School.
Ownership History
Date
Name
Owned For
Owner Type
Purchase Details
Closed on
Dec 13, 2019
Sold by
Janes Vance Geoffrey and Janes Laurie Cloud
Bought by
Walker Chelsea and Walker Ryan
Current Estimated Value
Home Financials for this Owner
Home Financials are based on the most recent Mortgage that was taken out on this home.
Original Mortgage
$240,562
Outstanding Balance
$212,090
Interest Rate
3.6%
Mortgage Type
FHA
Estimated Equity
$162,393
Purchase Details
Closed on
Jun 23, 2011
Sold by
Sdc Properties Llc
Bought by
Cloud Janes Vance Geoffrey and Cloud Janes Laurie
Home Financials for this Owner
Home Financials are based on the most recent Mortgage that was taken out on this home.
Original Mortgage
$237,486
Interest Rate
4.65%
Mortgage Type
VA
Purchase Details
Closed on
Dec 8, 2010
Sold by
The Boss King Group Llc
Bought by
Scdc Properties Llc
Purchase Details
Closed on
Nov 8, 2006
Sold by
Anderson Properties & Construction
Bought by
The Boss King Group Llc
Create a Home Valuation Report for This Property
The Home Valuation Report is an in-depth analysis detailing your home's value as well as a comparison with similar homes in the area
Home Values in the Area
Average Home Value in this Area
Purchase History
| Date | Buyer | Sale Price | Title Company |
|---|---|---|---|
| Walker Chelsea | $245,000 | None Available | |
| Cloud Janes Vance Geoffrey | $229,900 | None Available | |
| Scdc Properties Llc | $40,000 | None Available | |
| The Boss King Group Llc | $31,000 | -- |
Source: Public Records
Mortgage History
| Date | Status | Borrower | Loan Amount |
|---|---|---|---|
| Open | Walker Chelsea | $240,562 | |
| Previous Owner | Cloud Janes Vance Geoffrey | $237,486 |
Source: Public Records
Tax History Compared to Growth
Tax History
| Year | Tax Paid | Tax Assessment Tax Assessment Total Assessment is a certain percentage of the fair market value that is determined by local assessors to be the total taxable value of land and additions on the property. | Land | Improvement |
|---|---|---|---|---|
| 2024 | $4,152 | $126,880 | $16,000 | $110,880 |
| 2023 | $3,516 | $106,640 | $16,000 | $90,640 |
| 2022 | $2,280 | $99,160 | $16,000 | $83,160 |
| 2021 | $2,258 | $97,680 | $16,000 | $81,680 |
| 2020 | $2,259 | $97,240 | $16,000 | $81,240 |
| 2019 | $2,037 | $87,680 | $16,000 | $71,680 |
| 2018 | $2,037 | $87,680 | $16,000 | $71,680 |
| 2017 | $2,039 | $87,680 | $16,000 | $71,680 |
| 2016 | $2,042 | $87,680 | $16,000 | $71,680 |
| 2015 | -- | $87,680 | $16,000 | $71,680 |
| 2014 | -- | $87,680 | $16,000 | $71,680 |
| 2013 | -- | $87,680 | $16,000 | $71,680 |
Source: Public Records
Map
Nearby Homes
- 419 Morgan Ranch Cir
- 105 Anderson Ct
- 42.36 Acres Old Perry Rd
- 228 Morgan Ranch Cir
- 107 Ike Ct
- 112 Amargosa Place
- 113 Amargosa Place
- Cali Plan at Blue Ridge - Cottages
- Aria Plan at Blue Ridge - Cottages
- Macon Plan at Blue Ridge - Cottages
- Kerry Plan at Blue Ridge - Cottages
- 1399 Adirondac Way
- 1400 Adirondac Way
- 1401 Adirondac Way Unit Cali
- 414 Rustic Live Oak Trail
- 115 Sutter Butte Place
- 113 Sutter Butte Place
- 256 Ashley Nicole Ave
- 106 Catskill Ln
- 407 Morgan Ranch Cir
- 403 Morgan Ranch Cir
- 97 Anderson Ct
- 409 Morgan Ranch Cir
- 401 Morgan Ranch Cir
- 401 Morgan Ranch Cir Unit 68
- 408 Morgan Ranch Cir
- 410 Morgan Ranch Cir
- 99 Anderson Ct
- 404 Morgan Ranch Cir
- 412 Morgan Ranch Cir Unit 12
- 412 Morgan Ranch Cir
- 411 Morgan Ranch Cir
- 402 Morgan Ranch Cir
- 414 Morgan Ranch Cir
- 95 Anderson Ct
- 400 Morgan Ranch Cir
- 0 Anderson Ct Unit 8360266
- 0 Anderson Ct Unit 8308204
- 0 Anderson Ct Unit 7272628