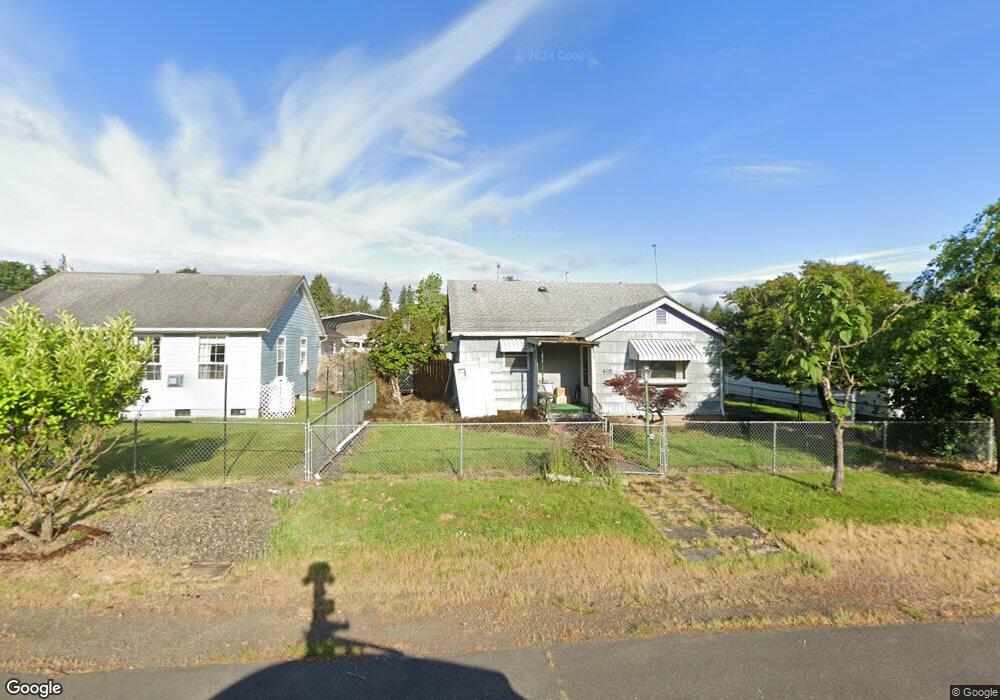
405 Morse St Ryderwood, WA 98581
Ryderwood NeighborhoodEstimated Value: $227,000 - $261,844
2
Beds
1
Bath
1,098
Sq Ft
$218/Sq Ft
Est. Value
About This Home
This home is located at 405 Morse St, Ryderwood, WA 98581 and is currently estimated at $239,461, approximately $218 per square foot. 405 Morse St is a home located in Cowlitz County with nearby schools including Castle Rock Elementary School, Castle Rock Middle School, and Castle Rock High School.
Ownership History
Date
Name
Owned For
Owner Type
Purchase Details
Closed on
Jul 18, 2011
Sold by
The Secretary Of Housing & Urban Develop
Bought by
Nash Gordon Charles
Current Estimated Value
Purchase Details
Closed on
Jul 12, 2010
Sold by
Suntrust Mortgage Inc
Bought by
The Secretary Of Housing & Urban Develop
Purchase Details
Closed on
May 6, 2010
Sold by
Johns Gayle P
Bought by
Suntrust Mortgage Inc
Purchase Details
Closed on
Aug 21, 2006
Sold by
Wallace Beverley and Wallace Beverly
Bought by
Johns Gayle P
Home Financials for this Owner
Home Financials are based on the most recent Mortgage that was taken out on this home.
Original Mortgage
$90,578
Interest Rate
6.7%
Mortgage Type
FHA
Create a Home Valuation Report for This Property
The Home Valuation Report is an in-depth analysis detailing your home's value as well as a comparison with similar homes in the area
Home Values in the Area
Average Home Value in this Area
Purchase History
| Date | Buyer | Sale Price | Title Company |
|---|---|---|---|
| Nash Gordon Charles | -- | Chicago Title Ins Van | |
| The Secretary Of Housing & Urban Develop | -- | Cowlitz Co Title | |
| Suntrust Mortgage Inc | $96,005 | Cowlitz County Title Company | |
| Johns Gayle P | $92,000 | Cascade Title Co |
Source: Public Records
Mortgage History
| Date | Status | Borrower | Loan Amount |
|---|---|---|---|
| Previous Owner | Johns Gayle P | $90,578 |
Source: Public Records
Tax History Compared to Growth
Tax History
| Year | Tax Paid | Tax Assessment Tax Assessment Total Assessment is a certain percentage of the fair market value that is determined by local assessors to be the total taxable value of land and additions on the property. | Land | Improvement |
|---|---|---|---|---|
| 2024 | $1,504 | $174,370 | $19,870 | $154,500 |
| 2023 | $1,417 | $165,560 | $19,870 | $145,690 |
| 2022 | $1,303 | $187,880 | $19,870 | $168,010 |
| 2021 | $1,215 | $149,870 | $19,870 | $130,000 |
| 2020 | $959 | $133,410 | $17,750 | $115,660 |
| 2019 | $757 | $108,351 | $16,900 | $91,451 |
| 2018 | $802 | $83,210 | $16,880 | $66,330 |
| 2017 | $723 | $76,030 | $16,080 | $59,950 |
| 2016 | $724 | $69,500 | $16,080 | $53,420 |
| 2015 | $716 | $69,500 | $16,080 | $53,420 |
| 2013 | -- | $71,530 | $17,290 | $54,240 |
Source: Public Records
Map
Nearby Homes