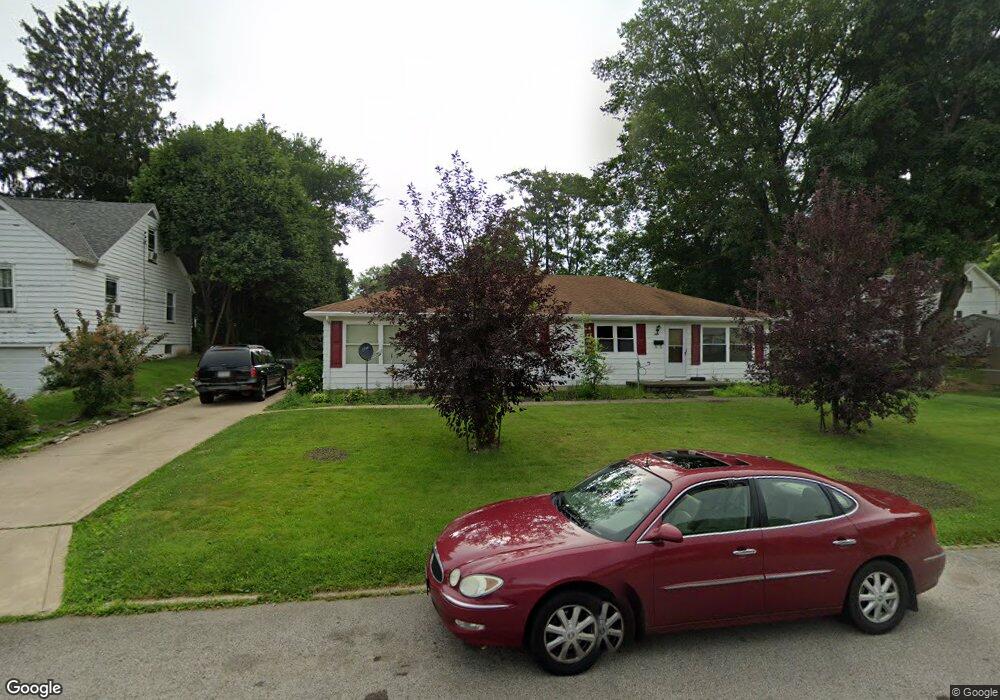
405 Muth Rd Unit 409 Mansfield, OH 44903
Estimated Value: $127,000 - $186,694
4
Beds
2
Baths
1,792
Sq Ft
$85/Sq Ft
Est. Value
About This Home
This home is located at 405 Muth Rd Unit 409, Mansfield, OH 44903 and is currently estimated at $151,674, approximately $84 per square foot. 405 Muth Rd Unit 409 is a home located in Richland County with nearby schools including Mansfield Elective Academy and Discovery School.
Ownership History
Date
Name
Owned For
Owner Type
Purchase Details
Closed on
Apr 11, 2025
Sold by
Histed Jeffrey L and Histed Kathleen
Bought by
Partin Rentals Llc
Current Estimated Value
Home Financials for this Owner
Home Financials are based on the most recent Mortgage that was taken out on this home.
Original Mortgage
$118,500
Outstanding Balance
$117,539
Interest Rate
6.63%
Mortgage Type
Construction
Estimated Equity
$34,135
Purchase Details
Closed on
Sep 7, 2006
Sold by
Hallman Donna J
Bought by
Histed Jeffrey L and Histed Kathleen
Home Financials for this Owner
Home Financials are based on the most recent Mortgage that was taken out on this home.
Original Mortgage
$124,500
Interest Rate
8.55%
Mortgage Type
Stand Alone First
Purchase Details
Closed on
Sep 30, 2002
Sold by
Smith Norbert F
Bought by
Hallman Dale J and Hallman Delores J
Purchase Details
Closed on
Dec 1, 1985
Create a Home Valuation Report for This Property
The Home Valuation Report is an in-depth analysis detailing your home's value as well as a comparison with similar homes in the area
Home Values in the Area
Average Home Value in this Area
Purchase History
| Date | Buyer | Sale Price | Title Company |
|---|---|---|---|
| Partin Rentals Llc | $115,000 | Empora Title | |
| Partin Rentals Llc | $115,000 | Empora Title | |
| Histed Jeffrey L | $124,500 | Barrister Title | |
| Hallman Dale J | $130,000 | -- | |
| -- | $46,000 | -- |
Source: Public Records
Mortgage History
| Date | Status | Borrower | Loan Amount |
|---|---|---|---|
| Open | Partin Rentals Llc | $118,500 | |
| Closed | Partin Rentals Llc | $118,500 | |
| Previous Owner | Histed Jeffrey L | $124,500 |
Source: Public Records
Tax History
| Year | Tax Paid | Tax Assessment Tax Assessment Total Assessment is a certain percentage of the fair market value that is determined by local assessors to be the total taxable value of land and additions on the property. | Land | Improvement |
|---|---|---|---|---|
| 2024 | $1,925 | $41,930 | $5,700 | $36,230 |
| 2023 | $1,966 | $41,930 | $5,700 | $36,230 |
| 2022 | $1,783 | $31,850 | $4,890 | $26,960 |
| 2021 | $1,795 | $31,850 | $4,890 | $26,960 |
| 2020 | $1,836 | $31,850 | $4,890 | $26,960 |
| 2019 | $2,034 | $31,850 | $4,890 | $26,960 |
| 2018 | $2,007 | $31,850 | $4,890 | $26,960 |
| 2017 | $1,953 | $31,850 | $4,890 | $26,960 |
| 2016 | $2,049 | $32,420 | $6,280 | $26,140 |
| 2015 | $1,958 | $32,420 | $6,280 | $26,140 |
| 2014 | $1,932 | $32,420 | $6,280 | $26,140 |
| 2012 | $736 | $32,410 | $6,600 | $25,810 |
Source: Public Records
Map
Nearby Homes
- 356 S Linden Rd
- 686 Barnard Ave
- 679 Coleman Rd
- 616 Cline Ave
- 535 Woodhill Rd
- 244 S Trimble Rd Unit 246
- 143 Fairlawn Ave
- 232 S Trimble Rd Unit 234
- 135 Fairlawn Ave
- 129 Fairlawn Ave
- 216 S Trimble Rd Unit 218
- 655 Woodhill Rd
- 0 Bally Row Unit Lot 22930 223011207
- 0 Bally Row Unit Lot 22929 223011206
- 0 Bally Row Unit Lot 22940 223011208
- 189 Westwood Ave
- 455 Marion Ave
- 988 Kentland Dr
- 133 Stewart Ave S
- 116 Stewart Ave S
- 399 Muth Rd
- 778 Millsboro Rd
- 786 Millsboro Rd
- 402 Fairlawn Ave
- 395 Muth Rd
- 768 Millsboro Rd Unit 770
- 396 Fairlawn Ave
- 764 Millsboro Rd
- 408 Muth Rd
- 402 Muth Rd
- 422 Muth Rd
- 420 Muth Rd Unit 422
- 387 Muth Rd
- 390 Fairlawn Ave
- 396 Muth Rd
- 392 Muth Rd
- 386 Fairlawn Ave
- 820 Millsboro Rd
- 381 Muth Rd
- 388 Muth Rd
Your Personal Tour Guide
Ask me questions while you tour the home.