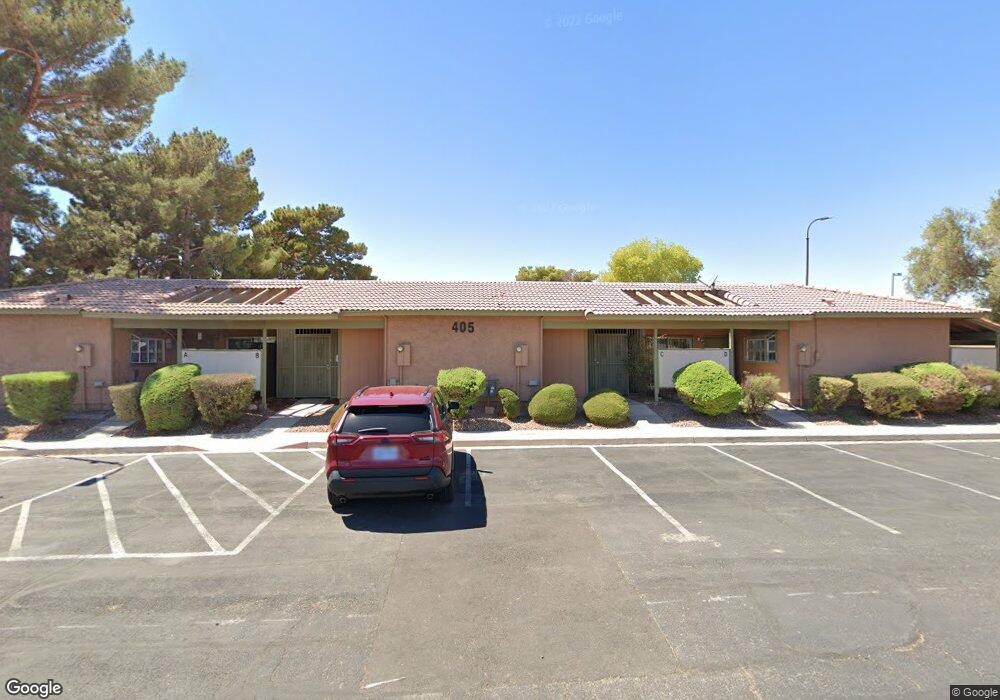
405 N Lamb Blvd Unit A Las Vegas, NV 89110
East Las Vegas NeighborhoodEstimated Value: $190,871 - $215,000
2
Beds
2
Baths
942
Sq Ft
$213/Sq Ft
Est. Value
About This Home
This home is located at 405 N Lamb Blvd Unit A, Las Vegas, NV 89110 and is currently estimated at $200,968, approximately $213 per square foot. 405 N Lamb Blvd Unit A is a home located in Clark County with nearby schools including William K. Moore Elementary School, Dell H Robison Middle School, and Desert Pines High School.
Ownership History
Date
Name
Owned For
Owner Type
Purchase Details
Closed on
Apr 26, 2001
Sold by
Leavitt Philip and Leavitt Jana A
Bought by
Smith Sandra L
Current Estimated Value
Home Financials for this Owner
Home Financials are based on the most recent Mortgage that was taken out on this home.
Original Mortgage
$66,939
Outstanding Balance
$24,902
Interest Rate
6.98%
Mortgage Type
FHA
Estimated Equity
$176,066
Purchase Details
Closed on
Oct 3, 2000
Sold by
Va
Bought by
Leavitt Philip and Leavitt Jana A
Home Financials for this Owner
Home Financials are based on the most recent Mortgage that was taken out on this home.
Original Mortgage
$40,850
Interest Rate
7.9%
Mortgage Type
Seller Take Back
Purchase Details
Closed on
Jul 5, 2000
Sold by
Regions Mtg Inc
Bought by
Va
Purchase Details
Closed on
Jun 16, 2000
Sold by
Crutchfield Robert L
Bought by
Regions Mtg Inc and Real Estate Financing Inc
Create a Home Valuation Report for This Property
The Home Valuation Report is an in-depth analysis detailing your home's value as well as a comparison with similar homes in the area
Home Values in the Area
Average Home Value in this Area
Purchase History
| Date | Buyer | Sale Price | Title Company |
|---|---|---|---|
| Smith Sandra L | $68,000 | Old Republic Title Company | |
| Leavitt Philip | -- | -- | |
| Va | -- | First American Title Co | |
| Regions Mtg Inc | $40,540 | Fidelity National Title |
Source: Public Records
Mortgage History
| Date | Status | Borrower | Loan Amount |
|---|---|---|---|
| Open | Smith Sandra L | $66,939 | |
| Previous Owner | Leavitt Philip | $40,850 |
Source: Public Records
Tax History Compared to Growth
Tax History
| Year | Tax Paid | Tax Assessment Tax Assessment Total Assessment is a certain percentage of the fair market value that is determined by local assessors to be the total taxable value of land and additions on the property. | Land | Improvement |
|---|---|---|---|---|
| 2025 | $386 | $28,502 | $9,450 | $19,052 |
| 2024 | $375 | $28,502 | $9,450 | $19,052 |
| 2023 | $305 | $28,397 | $10,150 | $18,247 |
| 2022 | $364 | $27,745 | $10,150 | $17,595 |
| 2021 | $354 | $21,122 | $6,300 | $14,822 |
| 2020 | $340 | $21,597 | $5,950 | $15,647 |
| 2019 | $330 | $21,021 | $5,250 | $15,771 |
| 2018 | $321 | $19,181 | $3,850 | $15,331 |
| 2017 | $531 | $15,457 | $2,450 | $13,007 |
| 2016 | $305 | $14,043 | $2,450 | $11,593 |
| 2015 | $303 | $11,296 | $2,100 | $9,196 |
| 2014 | $294 | $8,110 | $1,750 | $6,360 |
Source: Public Records
Map
Nearby Homes
- 413 N Lamb Blvd Unit F
- 425 N Lamb Blvd Unit D
- 408 Rhoda St
- 445 N Lamb Blvd Unit C
- 255 N Lamb Blvd Unit D
- 453 N Lamb Blvd Unit F
- 461 N Lamb Blvd Unit H
- 4428 Ash Ave
- 211 N Lamb Blvd Unit A
- 211 N Lamb Blvd Unit D
- 217 N Lamb Blvd Unit C
- 275 N Lamb Blvd Unit A
- 215 N Lamb Blvd Unit C
- 213 N Lamb Blvd Unit F
- 4436 E Ogden Ave
- 227 N Lamb Blvd Unit B
- 4437 Isabella Ave
- 4108 Montebello Ave
- 4117 Lighthouse Ave
- 4533 Diamond Head Dr
- 405 N Lamb Blvd Unit E
- 405 N Lamb Blvd Unit G
- 405 N Lamb Blvd Unit H
- 405 N Lamb Blvd Unit D
- 405 N Lamb Blvd Unit F
- 405 N Lamb Blvd Unit B
- 405 N Lamb Blvd Unit C
- 401 N Lamb Blvd Unit G
- 401 N Lamb Blvd Unit C
- 401 N Lamb Blvd Unit H
- 401 N Lamb Blvd Unit B
- 401 N Lamb Blvd Unit E
- 401 N Lamb Blvd Unit F
- 401 N Lamb Blvd Unit A
- 409 N Lamb Blvd Unit H
- 409 N Lamb Blvd Unit E
- 409 N Lamb Blvd Unit B
- 409 N Lamb Blvd Unit G
- 409 N Lamb Blvd Unit A
- 409 N Lamb Blvd Unit F