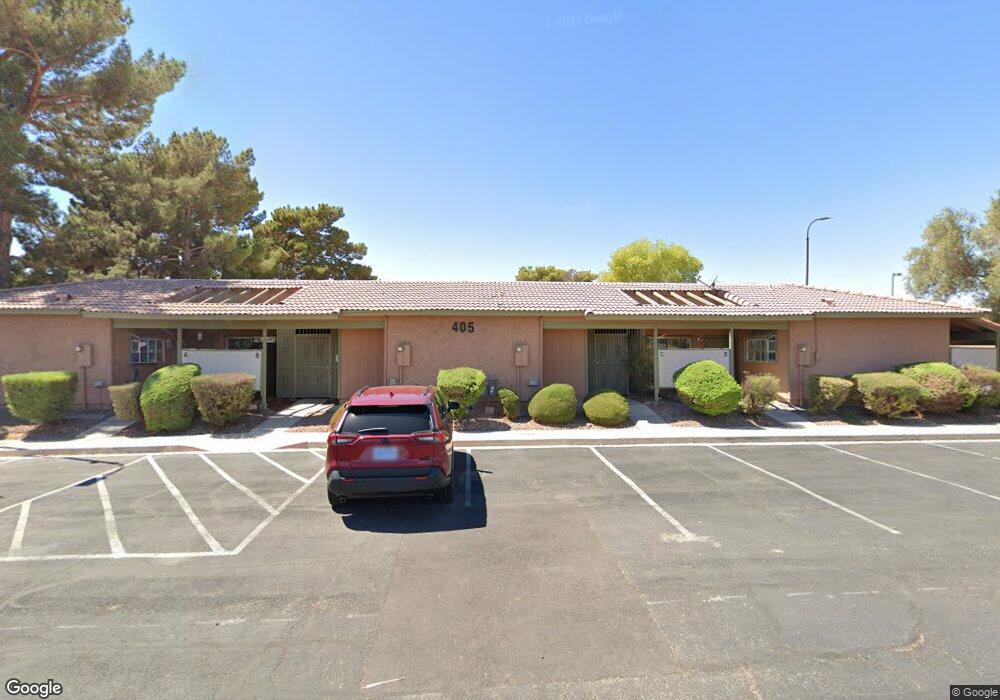
405 N Lamb Blvd Unit C Las Vegas, NV 89110
East Las Vegas NeighborhoodEstimated Value: $139,000 - $175,000
1
Bed
1
Bath
599
Sq Ft
$254/Sq Ft
Est. Value
About This Home
This home is located at 405 N Lamb Blvd Unit C, Las Vegas, NV 89110 and is currently estimated at $151,917, approximately $253 per square foot. 405 N Lamb Blvd Unit C is a home located in Clark County with nearby schools including William K. Moore Elementary School, Dell H Robison Middle School, and Desert Pines High School.
Ownership History
Date
Name
Owned For
Owner Type
Purchase Details
Closed on
Dec 16, 2024
Sold by
Barber Steven L
Bought by
Twins 24 Trust and Barber
Current Estimated Value
Purchase Details
Closed on
Dec 8, 2009
Sold by
Barber Terri Bond
Bought by
Barber Steven L
Create a Home Valuation Report for This Property
The Home Valuation Report is an in-depth analysis detailing your home's value as well as a comparison with similar homes in the area
Home Values in the Area
Average Home Value in this Area
Purchase History
| Date | Buyer | Sale Price | Title Company |
|---|---|---|---|
| Twins 24 Trust | -- | None Listed On Document | |
| Twins 24 Trust | -- | None Listed On Document | |
| Barber Steven L | -- | None Available |
Source: Public Records
Tax History Compared to Growth
Tax History
| Year | Tax Paid | Tax Assessment Tax Assessment Total Assessment is a certain percentage of the fair market value that is determined by local assessors to be the total taxable value of land and additions on the property. | Land | Improvement |
|---|---|---|---|---|
| 2025 | $360 | $22,104 | $9,450 | $12,654 |
| 2024 | $360 | $22,104 | $9,450 | $12,654 |
| 2023 | $360 | $22,318 | $10,150 | $12,168 |
| 2022 | $334 | $21,872 | $10,150 | $11,722 |
| 2021 | $309 | $16,470 | $6,300 | $10,170 |
| 2020 | $284 | $16,670 | $5,950 | $10,720 |
| 2019 | $266 | $16,043 | $5,250 | $10,793 |
| 2018 | $254 | $14,342 | $3,850 | $10,492 |
| 2017 | $390 | $11,166 | $2,450 | $8,716 |
| 2016 | $240 | $10,217 | $2,450 | $7,767 |
| 2015 | $237 | $8,274 | $2,100 | $6,174 |
| 2014 | $230 | $6,041 | $1,750 | $4,291 |
Source: Public Records
Map
Nearby Homes
- 413 N Lamb Blvd Unit F
- 425 N Lamb Blvd Unit D
- 408 Rhoda St
- 445 N Lamb Blvd Unit C
- 255 N Lamb Blvd Unit D
- 453 N Lamb Blvd Unit F
- 461 N Lamb Blvd Unit H
- 4428 Ash Ave
- 211 N Lamb Blvd Unit A
- 211 N Lamb Blvd Unit D
- 217 N Lamb Blvd Unit C
- 275 N Lamb Blvd Unit A
- 215 N Lamb Blvd Unit C
- 213 N Lamb Blvd Unit F
- 4436 E Ogden Ave
- 227 N Lamb Blvd Unit B
- 4437 Isabella Ave
- 4108 Montebello Ave
- 4117 Lighthouse Ave
- 4533 Diamond Head Dr
- 405 N Lamb Blvd Unit E
- 405 N Lamb Blvd Unit G
- 405 N Lamb Blvd Unit A
- 405 N Lamb Blvd Unit H
- 405 N Lamb Blvd Unit D
- 405 N Lamb Blvd Unit F
- 405 N Lamb Blvd Unit B
- 401 N Lamb Blvd Unit G
- 401 N Lamb Blvd Unit C
- 401 N Lamb Blvd Unit H
- 401 N Lamb Blvd Unit B
- 401 N Lamb Blvd Unit E
- 401 N Lamb Blvd Unit F
- 401 N Lamb Blvd Unit A
- 409 N Lamb Blvd Unit H
- 409 N Lamb Blvd Unit E
- 409 N Lamb Blvd Unit B
- 409 N Lamb Blvd Unit G
- 409 N Lamb Blvd Unit A
- 409 N Lamb Blvd Unit F