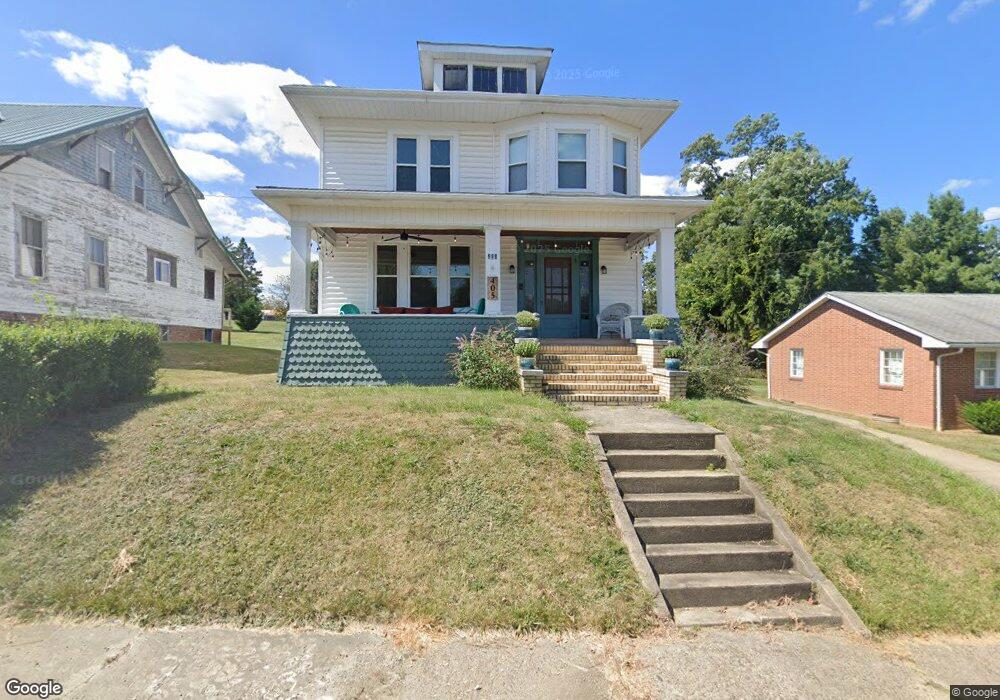
405 N Main St Bethesda, OH 43719
Estimated Value: $131,749 - $239,000
4
Beds
2
Baths
1,886
Sq Ft
$92/Sq Ft
Est. Value
About This Home
This home is located at 405 N Main St, Bethesda, OH 43719 and is currently estimated at $173,937, approximately $92 per square foot. 405 N Main St is a home located in Belmont County with nearby schools including Union Local Elementary School, Union Local Middle School, and Union Local High School.
Ownership History
Date
Name
Owned For
Owner Type
Purchase Details
Closed on
Jan 7, 2022
Sold by
Gregor Kriss A and Gregor Valerie
Bought by
Barnes Lacey N
Current Estimated Value
Home Financials for this Owner
Home Financials are based on the most recent Mortgage that was taken out on this home.
Original Mortgage
$71,241
Outstanding Balance
$56,143
Interest Rate
2.43%
Mortgage Type
New Conventional
Estimated Equity
$117,794
Purchase Details
Closed on
Oct 21, 2020
Bought by
Gregor Mary Margaret
Purchase Details
Closed on
Aug 19, 2020
Sold by
Estate Of James Harold Gregor
Bought by
Gregor Mary Margaret
Purchase Details
Closed on
May 13, 1999
Sold by
Gregor Philip Kriss James
Bought by
Gregor Philip Kriss James
Purchase Details
Closed on
Jan 1, 1986
Sold by
Gregor Louise H
Bought by
Gregor Louise H
Create a Home Valuation Report for This Property
The Home Valuation Report is an in-depth analysis detailing your home's value as well as a comparison with similar homes in the area
Home Values in the Area
Average Home Value in this Area
Purchase History
| Date | Buyer | Sale Price | Title Company |
|---|---|---|---|
| Barnes Lacey N | $100,000 | Leaman W Scott | |
| Barnes Lacey N | $100,000 | None Listed On Document | |
| Gregor Mary Margaret | -- | -- | |
| Gregor Mary Margaret | -- | None Available | |
| Gregor Philip Kriss James | -- | -- | |
| Gregor Louise H | -- | -- |
Source: Public Records
Mortgage History
| Date | Status | Borrower | Loan Amount |
|---|---|---|---|
| Open | Barnes Lacey N | $71,241 | |
| Closed | Barnes Lacey N | $71,241 |
Source: Public Records
Tax History Compared to Growth
Tax History
| Year | Tax Paid | Tax Assessment Tax Assessment Total Assessment is a certain percentage of the fair market value that is determined by local assessors to be the total taxable value of land and additions on the property. | Land | Improvement |
|---|---|---|---|---|
| 2024 | $1,348 | $37,750 | $2,020 | $35,730 |
| 2023 | $1,105 | $29,140 | $1,590 | $27,550 |
| 2022 | $1,131 | $29,144 | $1,592 | $27,552 |
| 2021 | $1,127 | $29,154 | $1,592 | $27,562 |
| 2020 | $1,042 | $1,330 | $0 | $1,330 |
| 2019 | $982 | $25,350 | $1,390 | $23,960 |
| 2018 | $982 | $25,350 | $1,390 | $23,960 |
| 2017 | $1,068 | $26,590 | $1,230 | $25,360 |
| 2016 | $1,073 | $26,590 | $1,230 | $25,360 |
| 2015 | $1,102 | $26,590 | $1,230 | $25,360 |
| 2014 | $1,008 | $24,180 | $1,120 | $23,060 |
| 2013 | $897 | $24,180 | $1,120 | $23,060 |
Source: Public Records
Map
Nearby Homes
- 319 N Main St
- 121 Maple Ave
- 208 Maple Ave
- 224 N Main St
- 101 Willow St
- 40521 Badgersburg Rd
- 331 Front St
- 201 Pear Unit Lot23
- 201 Pear Unit LOT 31
- 201 Pear Unit 21
- 201 Pear Unit LOT 6
- 201 Brown St
- 63626 Brads Way
- 66164 Belmont Morristown Rd
- 39991 National Rd
- 0 National Rd Unit 5154946
- 0 National Rd
- 62700 Oak Ln
- INLOT 19 Havenwood
- 40900 Havenwood Dr