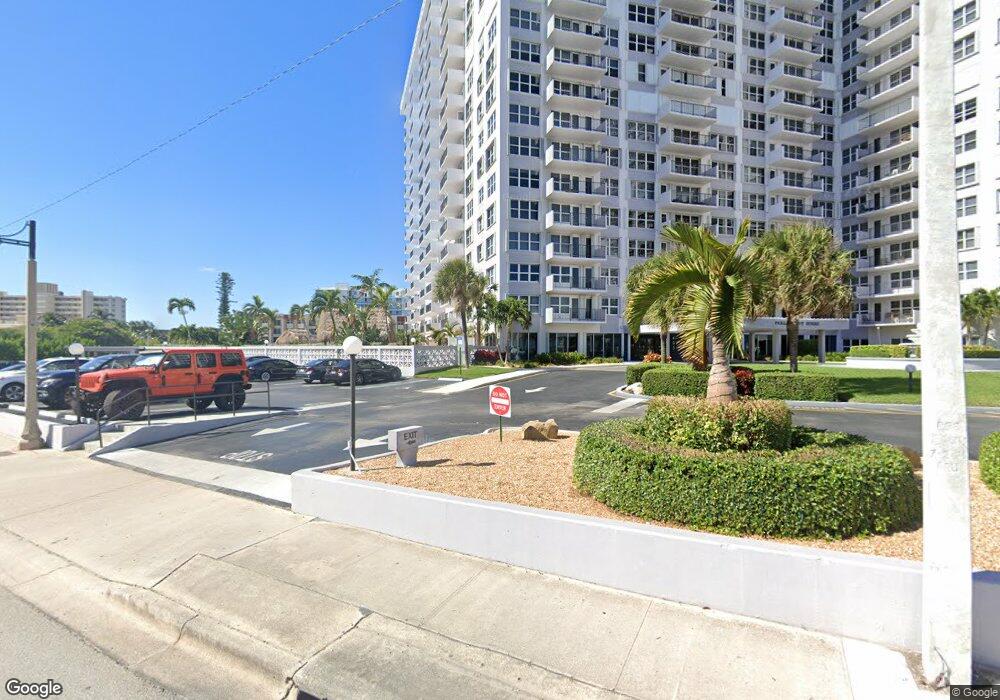
Parliament House 405 N Ocean Blvd Unit 330 Pompano Beach, FL 33062
Beachside Pompano Beach NeighborhoodEstimated Value: $462,899
2
Beds
2
Baths
1,265
Sq Ft
$366/Sq Ft
Est. Value
About This Home
This home is located at 405 N Ocean Blvd Unit 330, Pompano Beach, FL 33062 and is currently priced at $462,899, approximately $365 per square foot. 405 N Ocean Blvd Unit 330 is a home located in Broward County with nearby schools including Pompano Beach Middle School, Blanche Ely High School, and St Coleman School.
Ownership History
Date
Name
Owned For
Owner Type
Purchase Details
Closed on
Apr 11, 2007
Sold by
Katz Christine and Kemeny Yvonne
Bought by
Penge Aldo and Penge Estelle
Current Estimated Value
Home Financials for this Owner
Home Financials are based on the most recent Mortgage that was taken out on this home.
Original Mortgage
$100,000
Outstanding Balance
$59,862
Interest Rate
6.15%
Mortgage Type
Purchase Money Mortgage
Purchase Details
Closed on
Aug 2, 2004
Sold by
Kemeny Leslie
Bought by
Kemeny Leslie
Purchase Details
Closed on
Jan 31, 1995
Sold by
Wickstrom Richard D and Wickstrom Ethel D
Bought by
Sun Bk Gulf Coast
Purchase Details
Closed on
Jan 30, 1993
Sold by
Sun Bk Gulf Coast
Bought by
Kemeny Leslie R and Kemeny Ingalill
Home Financials for this Owner
Home Financials are based on the most recent Mortgage that was taken out on this home.
Original Mortgage
$50,000
Interest Rate
9.14%
Create a Home Valuation Report for This Property
The Home Valuation Report is an in-depth analysis detailing your home's value as well as a comparison with similar homes in the area
Home Values in the Area
Average Home Value in this Area
Purchase History
| Date | Buyer | Sale Price | Title Company |
|---|---|---|---|
| Penge Aldo | $275,000 | Attorney | |
| Kemeny Leslie | -- | -- | |
| Sun Bk Gulf Coast | -- | -- | |
| Kemeny Leslie R | $95,000 | -- |
Source: Public Records
Mortgage History
| Date | Status | Borrower | Loan Amount |
|---|---|---|---|
| Open | Penge Aldo | $100,000 | |
| Previous Owner | Kemeny Leslie R | $50,000 |
Source: Public Records
Tax History Compared to Growth
Tax History
| Year | Tax Paid | Tax Assessment Tax Assessment Total Assessment is a certain percentage of the fair market value that is determined by local assessors to be the total taxable value of land and additions on the property. | Land | Improvement |
|---|---|---|---|---|
| 2025 | $3,510 | $208,060 | -- | -- |
| 2024 | $3,545 | $202,200 | -- | -- |
| 2023 | $3,545 | $196,320 | $0 | $0 |
| 2022 | $3,298 | $190,610 | $0 | $0 |
| 2021 | $3,172 | $185,060 | $0 | $0 |
| 2020 | $3,074 | $182,510 | $0 | $0 |
| 2019 | $3,017 | $178,410 | $0 | $0 |
| 2018 | $2,892 | $175,090 | $0 | $0 |
| 2017 | $2,739 | $171,490 | $0 | $0 |
| 2016 | $2,688 | $167,970 | $0 | $0 |
| 2015 | $2,756 | $166,810 | $0 | $0 |
| 2014 | $2,745 | $165,490 | $0 | $0 |
| 2013 | -- | $164,940 | $16,490 | $148,450 |
Source: Public Records
About Parliament House
Map
Nearby Homes
- 405 N Ocean Blvd Unit 1922
- 405 N Ocean Blvd Unit 329
- 405 N Ocean Blvd Unit 1027
- 405 N Ocean Blvd Unit 1116
- 405 N Ocean Blvd Unit 611
- 405 N Ocean Blvd Unit 815
- 405 N Ocean Blvd Unit 507
- 405 N Ocean Blvd Unit 122
- 405 N Ocean Blvd Unit 623
- 405 N Ocean Blvd Unit 306
- 499 N Ocean Blvd Unit 4
- 328 N Ocean Blvd Unit 1008
- 328 N Ocean Blvd Unit 1007
- 328 N Ocean Blvd Unit 101
- 328 N Ocean Blvd Unit 104
- 3210 NE 5th St Unit 202
- 3210 NE 5th St Unit 203
- 505 N Ocean Blvd
- 400 N Riverside Dr Unit 404
- 400 N Riverside Dr Unit 102
- 405 N Ocean Blvd Unit 1615
- 405 N Ocean Blvd Unit 802
- 405 N Ocean Blvd Unit 1620
- 405 N Ocean Blvd Unit 820
- 405 N Ocean Blvd Unit 1202
- 405 N Ocean Blvd Unit 503
- 405 N Ocean Blvd Unit 104
- 405 N Ocean Blvd Unit 215
- 405 N Ocean Blvd Unit 1929
- 405 N Ocean Blvd Unit 127
- 405 N Ocean Blvd Unit 1520
- 405 N Ocean Blvd Unit 723
- 405 N Ocean Blvd Unit 423
- 405 N Ocean Blvd Unit 1422
- 405 N Ocean Blvd Unit 228
- 405 N Ocean Blvd Unit 501
- 405 N Ocean Blvd Unit 1824
- 405 N Ocean Blvd Unit 223
- 405 N Ocean Blvd Unit I-922
- 405 N Ocean Blvd Unit 1701