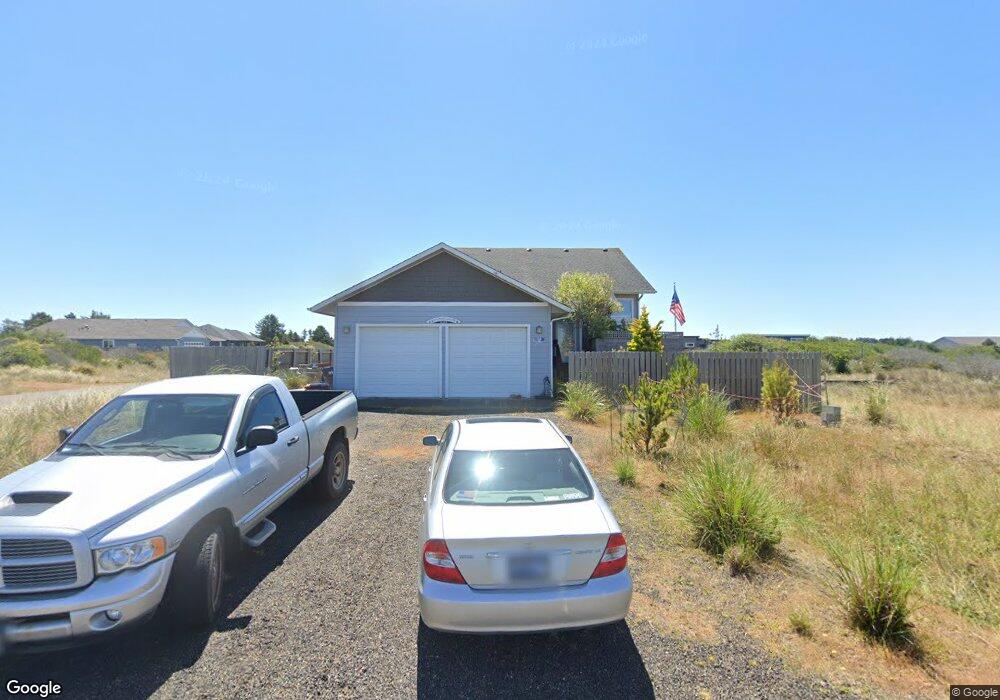
405 N Portal Loop SW Ocean Shores, WA 98569
Estimated Value: $414,000 - $432,000
3
Beds
3
Baths
1,506
Sq Ft
$281/Sq Ft
Est. Value
About This Home
This home is located at 405 N Portal Loop SW, Ocean Shores, WA 98569 and is currently estimated at $423,596, approximately $281 per square foot. 405 N Portal Loop SW is a home located in Grays Harbor County with nearby schools including North Beach Junior/Senior High School.
Ownership History
Date
Name
Owned For
Owner Type
Purchase Details
Closed on
Feb 6, 2019
Sold by
Wilson Brett and Cesko Wilson Edina
Bought by
Wilson Brett
Current Estimated Value
Home Financials for this Owner
Home Financials are based on the most recent Mortgage that was taken out on this home.
Original Mortgage
$156,800
Outstanding Balance
$130,785
Interest Rate
4.5%
Mortgage Type
New Conventional
Estimated Equity
$292,811
Purchase Details
Closed on
Sep 30, 2014
Sold by
Wilson Brett N
Bought by
Wilson Brett N and Cesko Wilson Edina
Home Financials for this Owner
Home Financials are based on the most recent Mortgage that was taken out on this home.
Original Mortgage
$166,500
Interest Rate
4.07%
Mortgage Type
New Conventional
Purchase Details
Closed on
Mar 8, 2013
Sold by
Harkness John L and Harkness Margaret J
Bought by
Wilson Brett N
Create a Home Valuation Report for This Property
The Home Valuation Report is an in-depth analysis detailing your home's value as well as a comparison with similar homes in the area
Home Values in the Area
Average Home Value in this Area
Purchase History
| Date | Buyer | Sale Price | Title Company |
|---|---|---|---|
| Wilson Brett | -- | Grays Harbor Title | |
| Wilson Brett N | -- | None Available | |
| Wilson Brett N | $8,500 | Grays Harbor Title |
Source: Public Records
Mortgage History
| Date | Status | Borrower | Loan Amount |
|---|---|---|---|
| Open | Wilson Brett | $156,800 | |
| Closed | Wilson Brett N | $166,500 |
Source: Public Records
Tax History Compared to Growth
Tax History
| Year | Tax Paid | Tax Assessment Tax Assessment Total Assessment is a certain percentage of the fair market value that is determined by local assessors to be the total taxable value of land and additions on the property. | Land | Improvement |
|---|---|---|---|---|
| 2025 | $2,617 | $413,250 | $45,000 | $368,250 |
| 2023 | $2,643 | $374,102 | $75,000 | $299,102 |
| 2022 | $2,473 | $292,590 | $54,200 | $238,390 |
| 2021 | $2,607 | $292,590 | $54,200 | $238,390 |
| 2020 | $2,447 | $252,485 | $37,375 | $215,110 |
| 2019 | $2,205 | $228,055 | $32,500 | $195,555 |
| 2018 | $2,333 | $200,210 | $25,000 | $175,210 |
| 2017 | $2,127 | $200,210 | $25,000 | $175,210 |
| 2016 | $1,560 | $178,595 | $22,000 | $156,595 |
| 2014 | -- | $136,355 | $13,600 | $122,755 |
| 2013 | -- | $17,000 | $17,000 | $0 |
Source: Public Records
Map
Nearby Homes
- 415 N Portal Loop SW
- 1249 E Ocean Shores Blvd SW
- 432 N Spinnaker St
- 1511 E Ocean Shores Blvd SW
- 1493 E Ocean Shores Blvd SW
- 1533 E Ocean Shores Blvd SW
- 1275 Channel Ave SW
- 1246 Camero Loop SW
- 453 N Bel Air Loop SW
- 437 S Bel Air Loop
- 428 S Bel Air Loop SW
- 1244 Camero Loop SW
- 413 S Portal Loop SW
- 1344 N Jetty SW
- 455 N Portal Loop SW
- 421 S Portal Loop SW
- 1375 Sand Pebble Ave SW
- 1383 Sand Pebble Ave SW
- 454 N Portal Loop SW
- 438 S Portal Loop SW
- 409 N Portal Loop SW
- 406 N Bel Air Loop SW
- 408 N Bel Air Loop SW
- 408 N Bel Air Loop SW
- 411 N Portal Loop SW
- 1299 Storm King Ave SW
- 1304 Storm King Ave SW
- 410 N Bel Air Loop SW
- 1300 Storm King Ave SW
- 1310 Storm King Ave SW
- 1293 Storm King Ave SW
- 1298 Fairwood Dr SW
- 413 N Portal Loop SW
- 1298 Storm King Ave SW
- 1314 Storm King Ave SW
- 1279 E Ocean Shores Blvd SW
- 412 N Bel Air Loop SW
- 412 N Bel Air Loop SW
- 1292 Fairwood Dr SW
- 1320 Storm King Ave SW