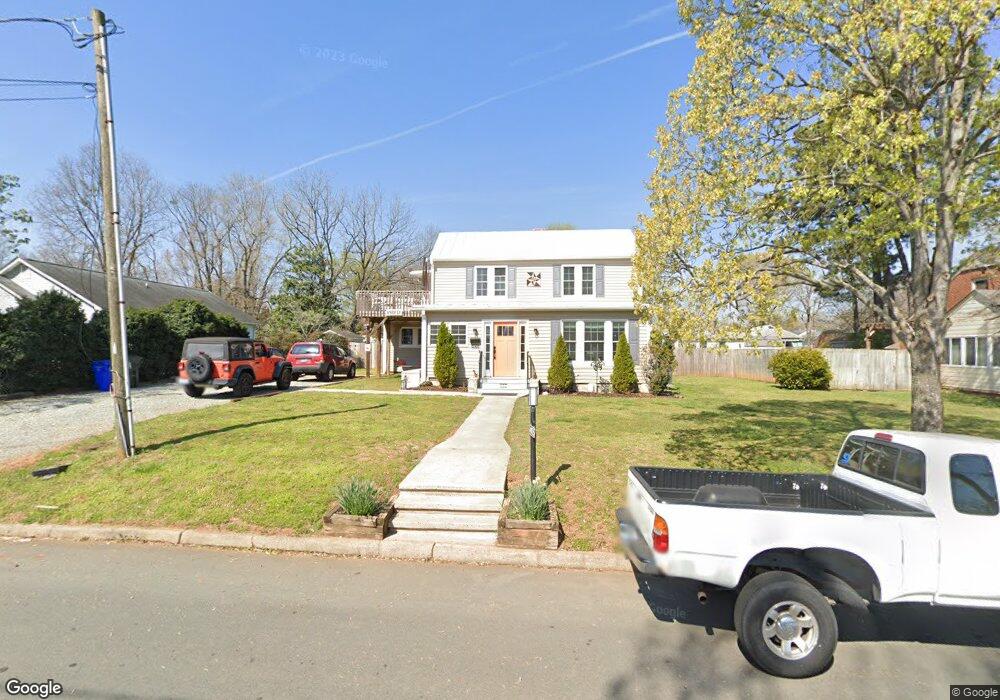
405 N Third St Mebane, NC 27302
Estimated Value: $367,000 - $459,000
4
Beds
2
Baths
2,438
Sq Ft
$174/Sq Ft
Est. Value
About This Home
This home is located at 405 N Third St, Mebane, NC 27302 and is currently estimated at $423,386, approximately $173 per square foot. 405 N Third St is a home located in Alamance County with nearby schools including E.M. Yoder Elementary School, Woodlawn Middle School, and Eastern Alamance High School.
Ownership History
Date
Name
Owned For
Owner Type
Purchase Details
Closed on
Aug 14, 2024
Sold by
Chamberlain Rebecca
Bought by
Rebecca Chamberlain Living Trust and Chamberlain
Current Estimated Value
Purchase Details
Closed on
Oct 6, 2017
Sold by
Murphy Kevin R and Murphy Cynthia A
Bought by
Chamberlain Rebecca
Home Financials for this Owner
Home Financials are based on the most recent Mortgage that was taken out on this home.
Original Mortgage
$189,050
Interest Rate
3.86%
Mortgage Type
New Conventional
Purchase Details
Closed on
Apr 23, 2012
Sold by
Mcnaughten Ronald E
Bought by
Murphy Kevin R
Home Financials for this Owner
Home Financials are based on the most recent Mortgage that was taken out on this home.
Original Mortgage
$170,901
Interest Rate
3.96%
Mortgage Type
VA
Create a Home Valuation Report for This Property
The Home Valuation Report is an in-depth analysis detailing your home's value as well as a comparison with similar homes in the area
Home Values in the Area
Average Home Value in this Area
Purchase History
| Date | Buyer | Sale Price | Title Company |
|---|---|---|---|
| Rebecca Chamberlain Living Trust | -- | None Listed On Document | |
| Chamberlain Rebecca | $199,000 | Attorney | |
| Murphy Kevin R | $168,000 | -- |
Source: Public Records
Mortgage History
| Date | Status | Borrower | Loan Amount |
|---|---|---|---|
| Previous Owner | Chamberlain Rebecca | $189,050 | |
| Previous Owner | Murphy Kevin R | $170,901 |
Source: Public Records
Tax History
| Year | Tax Paid | Tax Assessment Tax Assessment Total Assessment is a certain percentage of the fair market value that is determined by local assessors to be the total taxable value of land and additions on the property. | Land | Improvement |
|---|---|---|---|---|
| 2025 | $3,555 | $411,495 | $40,000 | $371,495 |
| 2024 | $3,452 | $411,495 | $40,000 | $371,495 |
| 2023 | $3,300 | $411,495 | $40,000 | $371,495 |
| 2022 | $1,974 | $177,124 | $32,000 | $145,124 |
| 2021 | $1,991 | $177,124 | $32,000 | $145,124 |
| 2020 | $2,009 | $177,124 | $32,000 | $145,124 |
| 2019 | $2,019 | $177,124 | $32,000 | $145,124 |
| 2018 | $0 | $177,124 | $32,000 | $145,124 |
| 2017 | $1,860 | $177,124 | $32,000 | $145,124 |
| 2016 | $1,617 | $151,092 | $30,000 | $121,092 |
| 2015 | $872 | $151,092 | $30,000 | $121,092 |
| 2014 | $800 | $151,618 | $30,000 | $121,618 |
Source: Public Records
Map
Nearby Homes
- 104 W Brown St
- Lot# 2 Highway 70 E
- 513 N Fifth St
- 112 N Sixth St
- 104 E Wilson St
- 421 W Holt St
- 608 W Holt St
- 211 N Ninth St
- 901 N Fifth St
- 205 Esteban Ct
- 106 Circle Dr
- 707 N Ninth St
- 401 S Eighth St
- 606 W Lee St
- 701 N Carr St
- 505 Hawfields Rd
- 603 W Mckinley St
- 704 E Ashland Dr
- 0 E Webb St
- 607 W Lebanon Rd
- 407 N Third St
- 401 N Third St
- 409 N Third St
- 400 N Second St
- 402 N Second St
- 404 N Second St
- 404 S Third St
- 406 N Second St
- 112 N Third St Unit 114
- 309 N Third St
- 406 N Third St
- 400 N 2nd St
- 408 N Second St
- 412 N Third St
- 417 N Third St
- 203 W Crawford St
- 308 N Third St
- 414 N Third St
- 405 N Second St
Your Personal Tour Guide
Ask me questions while you tour the home.