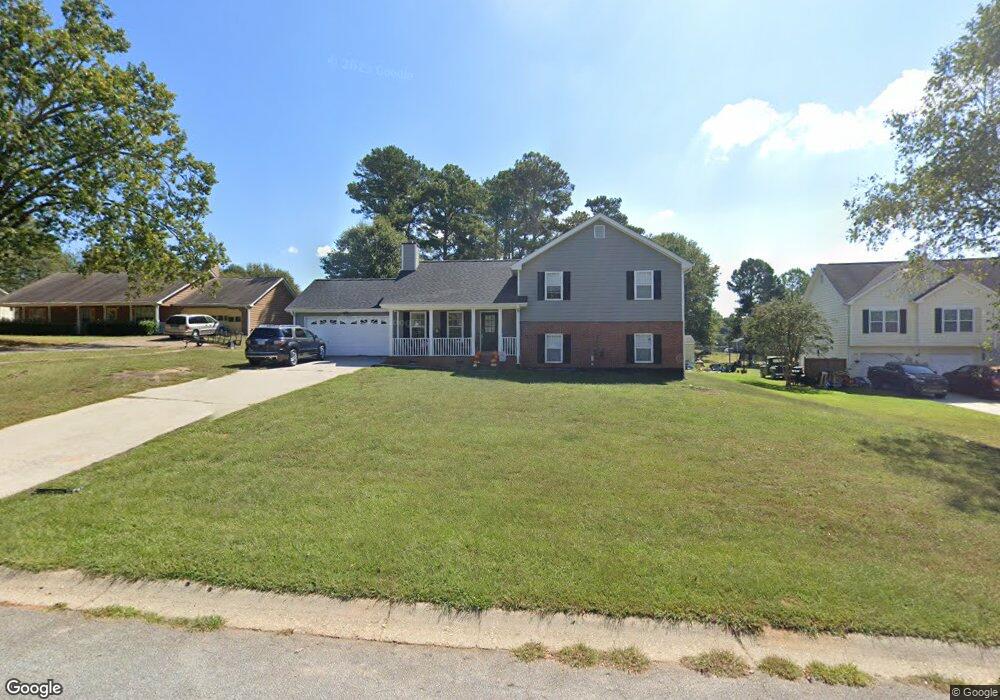
405 Nicole Ct Unit 2 Winder, GA 30680
Estimated Value: $360,655 - $411,000
3
Beds
3
Baths
2,158
Sq Ft
$178/Sq Ft
Est. Value
About This Home
This home is located at 405 Nicole Ct Unit 2, Winder, GA 30680 and is currently estimated at $384,414, approximately $178 per square foot. 405 Nicole Ct Unit 2 is a home located in Barrow County with nearby schools including Bramlett Elementary School, Russell Middle School, and Winder-Barrow High School.
Ownership History
Date
Name
Owned For
Owner Type
Purchase Details
Closed on
Jun 23, 2022
Sold by
Sfr Investments V Borrower 1 Llc
Bought by
Progress Residential Borrower 20 Llc
Current Estimated Value
Purchase Details
Closed on
Dec 17, 2021
Sold by
Zillow Homes Property Trust
Bought by
Sfr Investments V Borrower 1 Llc
Purchase Details
Closed on
Sep 10, 2021
Sold by
Kairos Buying Llc
Bought by
Zillow Homes Property Trust
Purchase Details
Closed on
Aug 23, 2021
Sold by
Oswell Jane C
Bought by
Kairos Buying Llc
Purchase Details
Closed on
Oct 25, 1996
Sold by
Reynolds James and Wade Don
Bought by
Oswell Jane
Purchase Details
Closed on
Jan 26, 1996
Sold by
Cgs Dev
Bought by
Reynolds James E
Purchase Details
Closed on
Oct 31, 1994
Bought by
C G S Development In
Create a Home Valuation Report for This Property
The Home Valuation Report is an in-depth analysis detailing your home's value as well as a comparison with similar homes in the area
Home Values in the Area
Average Home Value in this Area
Purchase History
| Date | Buyer | Sale Price | Title Company |
|---|---|---|---|
| Progress Residential Borrower 20 Llc | -- | -- | |
| Sfr Investments V Borrower 1 Llc | $3,428,113 | -- | |
| Zillow Homes Property Trust | $320,433 | -- | |
| Kairos Buying Llc | $249,150 | -- | |
| Oswell Jane | $101,900 | -- | |
| Reynolds James E | $15,000 | -- | |
| C G S Development In | -- | -- |
Source: Public Records
Mortgage History
| Date | Status | Borrower | Loan Amount |
|---|---|---|---|
| Closed | Reynolds James E | $0 |
Source: Public Records
Tax History Compared to Growth
Tax History
| Year | Tax Paid | Tax Assessment Tax Assessment Total Assessment is a certain percentage of the fair market value that is determined by local assessors to be the total taxable value of land and additions on the property. | Land | Improvement |
|---|---|---|---|---|
| 2024 | $3,487 | $140,238 | $20,000 | $120,238 |
| 2023 | $3,483 | $140,638 | $20,000 | $120,638 |
| 2022 | $2,851 | $98,500 | $20,000 | $78,500 |
| 2021 | $2,016 | $64,912 | $16,000 | $48,912 |
| 2020 | $2,020 | $64,912 | $16,000 | $48,912 |
| 2019 | $2,055 | $64,912 | $16,000 | $48,912 |
| 2018 | $1,908 | $60,802 | $14,200 | $46,602 |
| 2017 | $1,560 | $53,577 | $14,200 | $39,377 |
| 2016 | $1,376 | $48,814 | $14,200 | $34,614 |
| 2015 | $1,390 | $49,231 | $14,200 | $35,031 |
| 2014 | $1,236 | $42,824 | $6,958 | $35,866 |
| 2013 | -- | $40,601 | $6,958 | $33,643 |
Source: Public Records
Map
Nearby Homes
- 65 Cardinal Pond Ln
- 65 Cardinal Pond Ln Unit 9A
- 62 Cardinal Pond Ln Unit 5A
- 14 Bramblewood Dr
- 38 Cardinal Pond Ln Unit 3A
- 119 Wingate Rd
- 40 Cardinal Ridge Ct Unit 40A
- 38 Cardinal Pond Ln
- 40 Cardinal Ridge Ct
- 14 Bramblewood Dr Unit 38A
- Noah Plan at Summerlin
- Cambridge Plan at Summerlin
- Kingston Plan at Summerlin
- Colburn Plan at Summerlin
- Winston Plan at Summerlin
- Canterbury Plan at Summerlin
- Stanford Plan at Summerlin
- Turnbridge Plan at Summerlin
- Brooke UHP Plan at Summerlin
- Noble Plan at Summerlin
- 407 Nicole Ct
- 403 Nicole Ct Unit 2
- 403 Nicole Ct
- 409 Nicole Ct Unit 2
- 401 Nicole Ct Unit 2
- 406 Nicole Ct
- 412 Bee Maxey Rd Unit 1
- 400 Nicole Ct Unit 2
- 416 Bee Maxey Rd
- 408 Bee Maxey Rd
- 411 Nicole Ct Unit 2
- 420 Bee Maxey Rd Unit 1
- 404 Bee Maxey Rd
- 332 Carl Cedar Hill Rd
- 332 Carl Cedar Hill Rd Unit 1
- 410 Nicole Ct Unit 2
- 410 Nicole Ct
- 212 Ivey Ln
- 212 Ivey Ln
- 424 Bee Maxey Rd