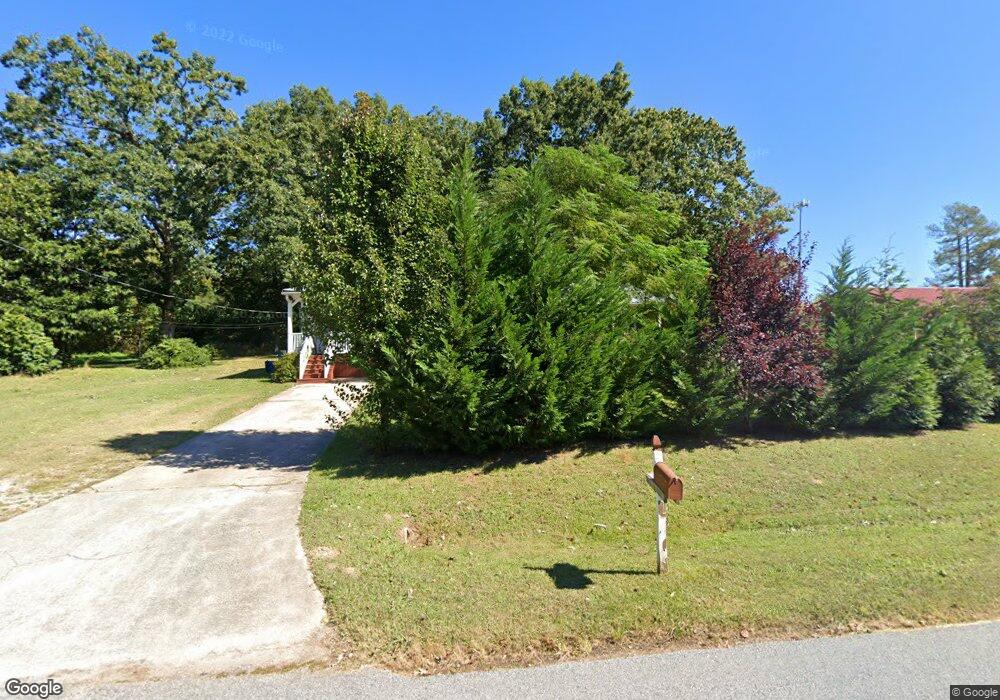
405 Paul St High Point, NC 27263
Greater High Point NeighborhoodEstimated Value: $182,000 - $245,000
3
Beds
1
Bath
1,568
Sq Ft
$133/Sq Ft
Est. Value
About This Home
This home is located at 405 Paul St, High Point, NC 27263 and is currently estimated at $208,334, approximately $132 per square foot. 405 Paul St is a home located in Guilford County with nearby schools including Allen Jay Elementary School, Southern Guilford Middle, and Southern Guilford High School.
Ownership History
Date
Name
Owned For
Owner Type
Purchase Details
Closed on
Jul 26, 2023
Sold by
Divorced Tanveer and Jabeen Salma
Bought by
Jabeen Salma and Mehmood Malik Saghar
Current Estimated Value
Purchase Details
Closed on
Jun 17, 2009
Sold by
Kestler Mary Ina and Kestler David W
Bought by
Ahmad Tanveer and Ahmad Salma
Home Financials for this Owner
Home Financials are based on the most recent Mortgage that was taken out on this home.
Original Mortgage
$78,551
Interest Rate
4.88%
Mortgage Type
FHA
Create a Home Valuation Report for This Property
The Home Valuation Report is an in-depth analysis detailing your home's value as well as a comparison with similar homes in the area
Home Values in the Area
Average Home Value in this Area
Purchase History
| Date | Buyer | Sale Price | Title Company |
|---|---|---|---|
| Jabeen Salma | -- | None Listed On Document | |
| Jabeen Salma | -- | None Listed On Document | |
| Ahmad Tanveer | $80,000 | None Available |
Source: Public Records
Mortgage History
| Date | Status | Borrower | Loan Amount |
|---|---|---|---|
| Previous Owner | Ahmad Tanveer | $78,551 |
Source: Public Records
Tax History
| Year | Tax Paid | Tax Assessment Tax Assessment Total Assessment is a certain percentage of the fair market value that is determined by local assessors to be the total taxable value of land and additions on the property. | Land | Improvement |
|---|---|---|---|---|
| 2025 | $881 | $100,400 | $22,000 | $78,400 |
| 2024 | $881 | $100,400 | $22,000 | $78,400 |
| 2023 | $881 | $100,400 | $22,000 | $78,400 |
| 2022 | $881 | $100,400 | $22,000 | $78,400 |
| 2021 | $720 | $82,100 | $22,000 | $60,100 |
| 2020 | $720 | $82,100 | $22,000 | $60,100 |
| 2019 | $720 | $82,100 | $0 | $0 |
| 2018 | $717 | $82,100 | $0 | $0 |
| 2017 | $698 | $82,100 | $0 | $0 |
| 2016 | $699 | $79,900 | $0 | $0 |
| 2015 | $703 | $79,900 | $0 | $0 |
| 2014 | $711 | $79,900 | $0 | $0 |
Source: Public Records
Map
Nearby Homes
- 116 Liberty Place
- 2107 Jefferson Ct
- 600 E Fairfield Rd
- 919 Belmont Dr
- 717 Belmont Dr
- 3630 Southpark Dr
- 715 Baker Rd
- 126 Apollo Cir
- 611 Liberty Rd
- 000 Liberty Rd
- 10844 N Main St
- 914 Nance Ave
- 408 Forestwood Dr
- 921 Norton St
- 10812, 10822, 10828 N Main St
- 2616 Ingram Rd
- 312 Playground Rd
- 1606 Chelsea Square
- 1105 E Springfield Rd
- 3813 Salisbury St
Your Personal Tour Guide
Ask me questions while you tour the home.