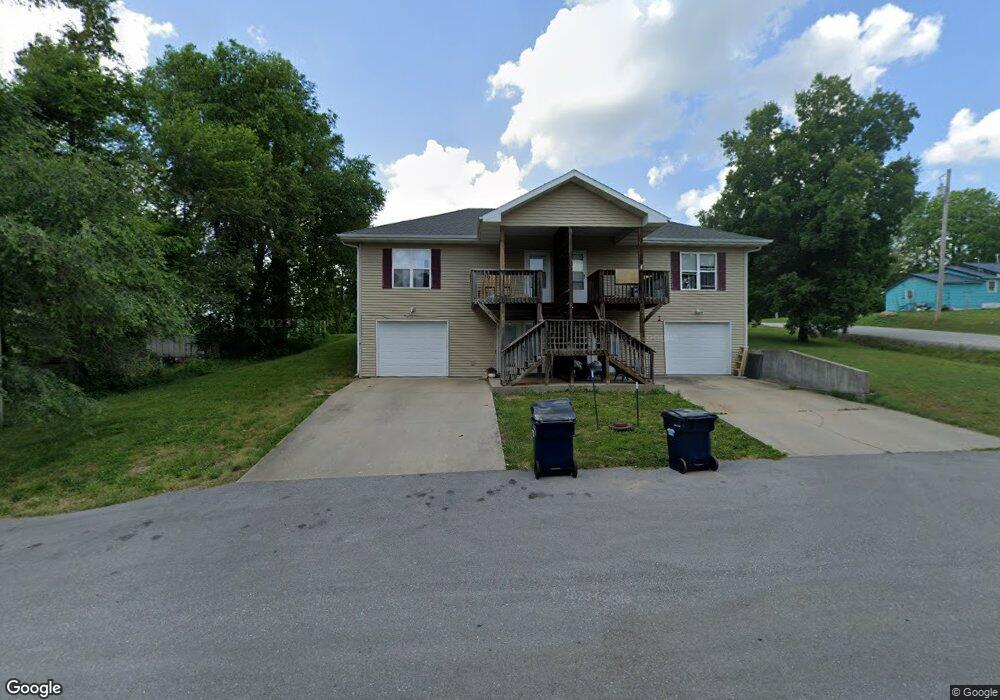
405 Pear Buffalo, MO 65622
Estimated Value: $200,535 - $257,000
--
Bed
4
Baths
2,344
Sq Ft
$99/Sq Ft
Est. Value
About This Home
This home is located at 405 Pear, Buffalo, MO 65622 and is currently estimated at $232,178, approximately $99 per square foot. 405 Pear is a home located in Dallas County with nearby schools including Buffalo High School.
Ownership History
Date
Name
Owned For
Owner Type
Purchase Details
Closed on
Dec 15, 2023
Sold by
Clark Family Trust
Bought by
Investment Core Llc
Current Estimated Value
Home Financials for this Owner
Home Financials are based on the most recent Mortgage that was taken out on this home.
Original Mortgage
$130,512
Outstanding Balance
$58,080
Interest Rate
7.76%
Mortgage Type
New Conventional
Estimated Equity
$174,098
Purchase Details
Closed on
Feb 16, 2023
Sold by
Clark Family Trust
Bought by
Bearfield Michael A and Bearfield Tabatha
Purchase Details
Closed on
Jun 1, 2021
Sold by
Sikes Brianna
Bought by
Clark Lonnie R and Clark Wilma I
Purchase Details
Closed on
Sep 19, 2006
Sold by
Spiegel Earl and Spiegel Georgeanna
Bought by
Fink Richard and Fink Geraldine
Home Financials for this Owner
Home Financials are based on the most recent Mortgage that was taken out on this home.
Original Mortgage
$115,000
Interest Rate
6.47%
Mortgage Type
Future Advance Clause Open End Mortgage
Create a Home Valuation Report for This Property
The Home Valuation Report is an in-depth analysis detailing your home's value as well as a comparison with similar homes in the area
Home Values in the Area
Average Home Value in this Area
Purchase History
| Date | Buyer | Sale Price | Title Company |
|---|---|---|---|
| Investment Core Llc | -- | None Listed On Document | |
| Bearfield Michael A | -- | -- | |
| Clark Lonnie R | -- | None Available | |
| Fink Richard | -- | None Available |
Source: Public Records
Mortgage History
| Date | Status | Borrower | Loan Amount |
|---|---|---|---|
| Open | Investment Core Llc | $130,512 | |
| Previous Owner | Fink Richard | $115,000 |
Source: Public Records
Tax History Compared to Growth
Tax History
| Year | Tax Paid | Tax Assessment Tax Assessment Total Assessment is a certain percentage of the fair market value that is determined by local assessors to be the total taxable value of land and additions on the property. | Land | Improvement |
|---|---|---|---|---|
| 2024 | $1,294 | $31,370 | $0 | $0 |
| 2023 | $1,177 | $26,560 | $0 | $0 |
| 2022 | $1,073 | $26,560 | $0 | $0 |
| 2021 | $1,074 | $23,980 | $0 | $0 |
| 2020 | $1,071 | $23,980 | $0 | $0 |
| 2019 | $1,073 | $23,980 | $0 | $0 |
| 2018 | $955 | $23,980 | $0 | $0 |
| 2017 | $955 | $23,980 | $0 | $0 |
| 2016 | $946 | $25,990 | $0 | $0 |
| 2015 | -- | $23,730 | $0 | $0 |
| 2014 | -- | $23,730 | $0 | $0 |
Source: Public Records
Map
Nearby Homes