Estimated Value: $184,000 - $224,723
About This Home
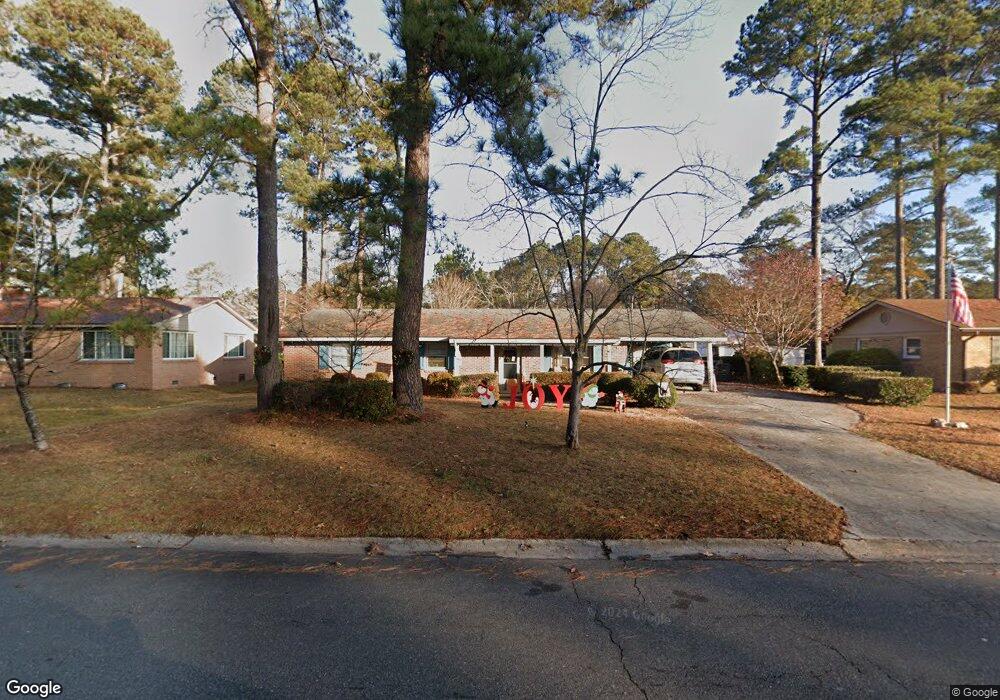
This home is located at 405 Pecan Dr, Selma, NC 27576 and is currently estimated at $204,181, approximately $136 per square foot. 405 Pecan Dr is a home located in Johnston County with nearby schools including Selma Elementary School, Selma Middle School, and Smithfield-Selma High School.
Ownership History
We collect this data history from publicly available records. To have your information removed, we recommend requesting removal directly through your county’s website.
Purchase Details
Home Financials for this Owner
Home Financials are based on the most recent Mortgage that was taken out on this home.Purchase Details
Purchase Details
Purchase Details
Purchase Details
Home Values in the Area
Average Home Value in this Area
Purchase History
We collect this data history from publicly available records. To have your information removed, we recommend requesting removal directly through your county’s website.
| Date | Buyer | Sale Price | Title Company |
|---|---|---|---|
| $92,000 | None Available | ||
| -- | None Available | ||
| -- | None Available | ||
| -- | -- | ||
| $68,000 | -- |
Mortgage History
We collect this data history from publicly available records. To have your information removed, we recommend requesting removal directly through your county’s website.
| Date | Status | Borrower | Loan Amount |
|---|---|---|---|
| Open | $87,400 |
Tax History
We collect this data history from publicly available records. To have your information removed, we recommend requesting removal directly through your county’s website.
| Year | Tax Paid | Tax Assessment Tax Assessment Total Assessment is a certain percentage of the fair market value that is determined by local assessors to be the total taxable value of land and additions on the property. | Land | Improvement |
|---|---|---|---|---|
| 2025 | $2,058 | $183,750 | $47,500 | $136,250 |
| 2024 | $1,374 | $108,220 | $27,550 | $80,670 |
| 2023 | $1,396 | $108,220 | $27,550 | $80,670 |
| 2022 | $1,439 | $108,220 | $27,550 | $80,670 |
| 2021 | $1,418 | $108,220 | $27,550 | $80,670 |
| 2020 | $1,439 | $108,220 | $27,550 | $80,670 |
| 2019 | $1,407 | $108,220 | $27,550 | $80,670 |
| 2018 | $1,374 | $104,090 | $27,270 | $76,820 |
| 2017 | $1,343 | $104,090 | $27,270 | $76,820 |
| 2016 | $1,343 | $104,090 | $27,270 | $76,820 |
| 2015 | $1,343 | $104,090 | $27,270 | $76,820 |
| 2014 | $1,343 | $104,090 | $27,270 | $76,820 |
Map
- 0 N Webb St Unit 749891
- 804 E Lizzie St
- 800 E Lizzie St
- 807 N Pollock St
- 601 Temple St
- 307 W Amber Oak Dr
- 501 N Raiford St
- 203 N Sellers St Unit A&B
- 401 N Massey St
- 408 E Waddell St
- 209 N Pollock St
- 5493 N Carolina 39 Hwy
- 201 N Massey St
- 0 Atkinson Mill Rd Unit 10022797
- 302 N Brevard St
- 301 N Brevard St
- 0 Bayleaf Rd
- 812 W Anderson St
- 3756 N Carolina 96
- 101 Thompson Dr
Ask me questions while you tour the home.