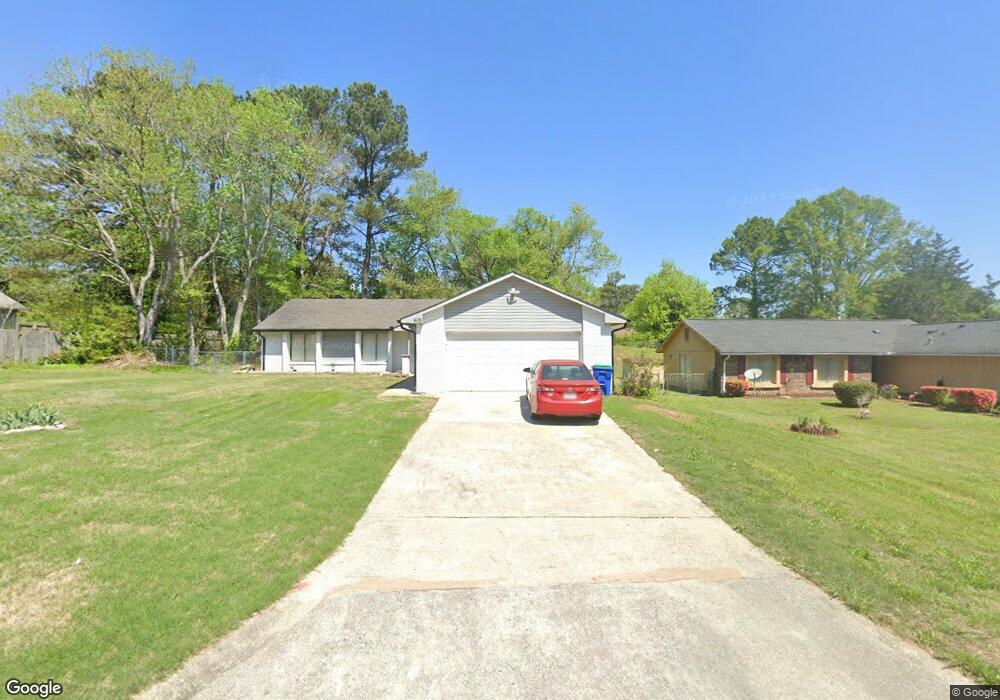
405 Piney Fork Ln Unit 3 Atlanta, GA 30349
Estimated Value: $208,000 - $266,000
3
Beds
2
Baths
1,282
Sq Ft
$182/Sq Ft
Est. Value
About This Home
This home is located at 405 Piney Fork Ln Unit 3, Atlanta, GA 30349 and is currently estimated at $233,544, approximately $182 per square foot. 405 Piney Fork Ln Unit 3 is a home located in Fulton County with nearby schools including Mcnair Middle School, Banneker High School, and Hapeville Charter Career Academy.
Ownership History
Date
Name
Owned For
Owner Type
Purchase Details
Closed on
Jan 26, 2024
Sold by
Sok Hieng
Bought by
Tolliver Letia
Current Estimated Value
Home Financials for this Owner
Home Financials are based on the most recent Mortgage that was taken out on this home.
Original Mortgage
$250,381
Outstanding Balance
$245,956
Interest Rate
6.61%
Mortgage Type
New Conventional
Estimated Equity
-$12,412
Purchase Details
Closed on
May 31, 2023
Sold by
Carter House Properties Llc
Bought by
Sok Hieng
Purchase Details
Closed on
Mar 19, 2011
Sold by
Hawkins Ryan
Bought by
Bigham Uyvonne and Robinson Arthur
Purchase Details
Closed on
Apr 26, 2010
Sold by
Bigham Uyvonne
Bought by
Hawkins Ryan
Home Financials for this Owner
Home Financials are based on the most recent Mortgage that was taken out on this home.
Original Mortgage
$70,000
Interest Rate
5.15%
Mortgage Type
Trade
Purchase Details
Closed on
Feb 2, 2010
Sold by
Worthy Thomas
Bought by
Us Bank Na Series 1998 & 2
Create a Home Valuation Report for This Property
The Home Valuation Report is an in-depth analysis detailing your home's value as well as a comparison with similar homes in the area
Home Values in the Area
Average Home Value in this Area
Purchase History
| Date | Buyer | Sale Price | Title Company |
|---|---|---|---|
| Tolliver Letia | $255,000 | -- | |
| Sok Hieng | $162,000 | -- | |
| Carter House Properties Llc | $150,000 | -- | |
| Bigham Uyvonne | -- | -- | |
| Hawkins Ryan | $70,000 | -- | |
| Bigham Uyvonne | $25,000 | -- | |
| Us Bank Na Series 1998 & 2 | $52,000 | -- |
Source: Public Records
Mortgage History
| Date | Status | Borrower | Loan Amount |
|---|---|---|---|
| Open | Tolliver Letia | $250,381 | |
| Previous Owner | Bigham Uyvonne | $70,000 |
Source: Public Records
Tax History Compared to Growth
Tax History
| Year | Tax Paid | Tax Assessment Tax Assessment Total Assessment is a certain percentage of the fair market value that is determined by local assessors to be the total taxable value of land and additions on the property. | Land | Improvement |
|---|---|---|---|---|
| 2025 | $2,496 | $92,120 | $13,320 | $78,800 |
| 2023 | $2,242 | $79,440 | $19,920 | $59,520 |
| 2022 | $2,251 | $57,400 | $15,840 | $41,560 |
| 2021 | $1,678 | $41,920 | $7,000 | $34,920 |
| 2020 | $1,600 | $39,320 | $5,640 | $33,680 |
| 2019 | $899 | $22,760 | $4,520 | $18,240 |
| 2018 | $884 | $22,200 | $4,400 | $17,800 |
| 2017 | $461 | $11,320 | $2,560 | $8,760 |
| 2016 | $461 | $11,320 | $2,560 | $8,760 |
| 2015 | $463 | $11,320 | $2,560 | $8,760 |
| 2014 | $488 | $11,320 | $2,560 | $8,760 |
Source: Public Records
Map
Nearby Homes
- 3065 Keenan Rd
- 6590 Kimberly Mill Rd
- 6595 Bellburn Rd
- 100 Spicewood Ct
- 2965 Forestside Ln Unit 4A
- 3250 Valley Bend Rd
- 6462 Beaver Creek Trail
- 3260 Valley Bend Rd Unit 2
- 6650 Smoke Ridge Dr
- 6785 Peppermill Ln
- 6505 Beaver Creek Trail
- 3484 Enterkin Ln
- 210 Springtree Ct
- 6405 Beaver Creek Trail
- 6940 Cainwood Dr
- 235 Whirlwind Ct Unit 1
- 2800 Greenbower Ct
- 2835 Sapphire St
- 3570 Keels Ln
- 6685 Greenbower Ln
- 0 Piney Fork Ln Unit 7264512
- 0 Piney Fork Ln Unit 3026602
- 0 Piney Fork Ln Unit 3010985
- 0 Piney Fork Ln
- 405 Piney Fork Ln
- 415 Piney Fork Ln
- 6670 Kimberly Mill Rd
- 6660 Kimberly Mill Rd
- 425 Piney Fork Ln
- 410 Piney Fork Ln
- 400 Piney Fork Ln
- 420 Piney Fork Ln
- 430 Piney Fork Ln Unit 3
- 6680 Kimberly Mill Rd
- 435 Piney Fork Ln
- 3040 Keenan Rd Unit 1
- 3030 Keenan Rd Unit 1
- 440 Piney Fork Ln
- 3045 Cadiz Cir
- 3020 Keenan Rd Unit 1