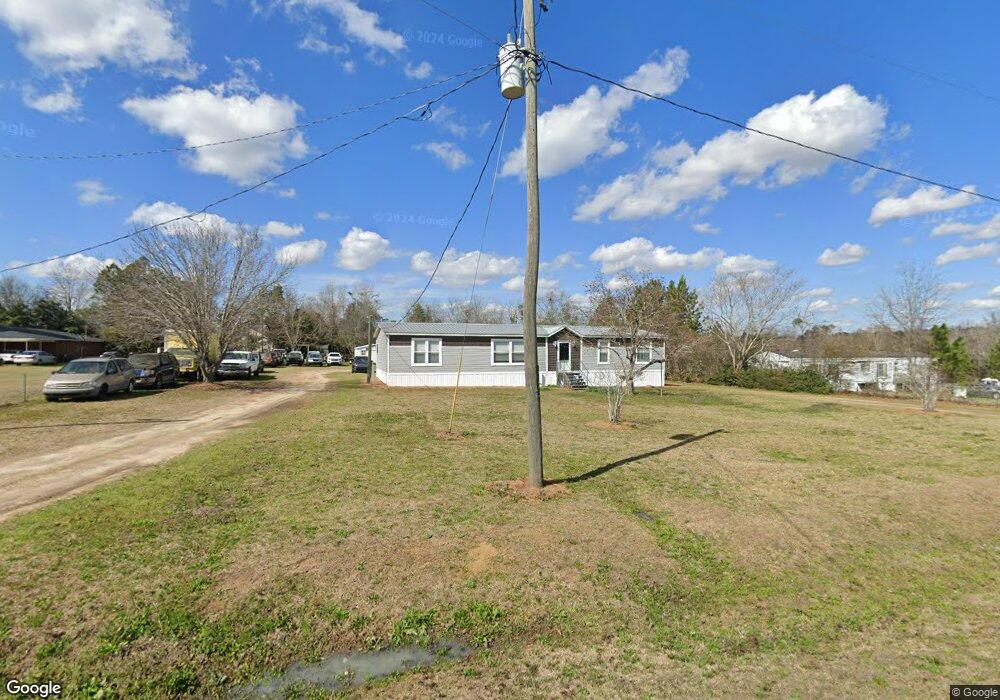
405 Portal Crossing Loop Portal, GA 30450
Estimated Value: $61,953 - $166,000
3
Beds
2
Baths
1,380
Sq Ft
$85/Sq Ft
Est. Value
About This Home
This home is located at 405 Portal Crossing Loop, Portal, GA 30450 and is currently estimated at $117,238, approximately $84 per square foot. 405 Portal Crossing Loop is a home located in Bulloch County with nearby schools including Portal Elementary School and Portal Middle/High School.
Ownership History
Date
Name
Owned For
Owner Type
Purchase Details
Closed on
Jul 2, 2020
Sold by
Blackburn Ricky E
Bought by
Blackburn Ricky Eugene and Owens Lisa Ann
Current Estimated Value
Home Financials for this Owner
Home Financials are based on the most recent Mortgage that was taken out on this home.
Original Mortgage
$110,901
Outstanding Balance
$91,697
Interest Rate
3.1%
Mortgage Type
New Conventional
Estimated Equity
$25,541
Purchase Details
Closed on
Sep 8, 2011
Sold by
Stubbs R E
Bought by
Blackburn Ricky E
Purchase Details
Closed on
Oct 6, 2009
Sold by
Wells Fargo Bank
Bought by
Secretary Of Housing
Purchase Details
Closed on
Feb 24, 2005
Sold by
Hutcheson W Darrel
Bought by
Ellerbee Robert A and Ellerbee Alicia
Home Financials for this Owner
Home Financials are based on the most recent Mortgage that was taken out on this home.
Original Mortgage
$68,426
Interest Rate
5.6%
Mortgage Type
FHA
Purchase Details
Closed on
Aug 1, 2003
Bought by
Hutcheson W Darrel
Create a Home Valuation Report for This Property
The Home Valuation Report is an in-depth analysis detailing your home's value as well as a comparison with similar homes in the area
Home Values in the Area
Average Home Value in this Area
Purchase History
| Date | Buyer | Sale Price | Title Company |
|---|---|---|---|
| Blackburn Ricky Eugene | -- | -- | |
| Blackburn Ricky E | $45,000 | -- | |
| Secretary Of Housing | -- | -- | |
| Ellerbee Robert A | $69,500 | -- | |
| Hutcheson W Darrel | -- | -- |
Source: Public Records
Mortgage History
| Date | Status | Borrower | Loan Amount |
|---|---|---|---|
| Open | Blackburn Ricky Eugene | $110,901 | |
| Previous Owner | Ellerbee Robert A | $68,426 |
Source: Public Records
Tax History Compared to Growth
Tax History
| Year | Tax Paid | Tax Assessment Tax Assessment Total Assessment is a certain percentage of the fair market value that is determined by local assessors to be the total taxable value of land and additions on the property. | Land | Improvement |
|---|---|---|---|---|
| 2024 | $191 | $6,580 | $4,840 | $1,740 |
| 2023 | $205 | $6,588 | $4,840 | $1,748 |
| 2022 | $144 | $6,662 | $4,872 | $1,790 |
| 2021 | $147 | $6,662 | $4,872 | $1,790 |
| 2020 | $640 | $30,178 | $4,872 | $25,306 |
| 2019 | $648 | $30,376 | $4,872 | $25,504 |
| 2018 | $672 | $30,456 | $4,872 | $25,584 |
| 2017 | $670 | $30,025 | $4,872 | $25,153 |
| 2016 | $627 | $27,349 | $4,872 | $22,477 |
| 2015 | $643 | $27,954 | $4,872 | $23,082 |
| 2014 | $636 | $27,954 | $4,872 | $23,082 |
Source: Public Records
Map
Nearby Homes
- 218 Turpentine Dr
- 2 Finch St
- 0 U S 80 Unit 10535643
- 525 Horsefly Rd
- 28022 U S 80
- 1717 Grady Saunders Rd
- 296 Pleasant Hill Rd
- 336 Pleasant Hill Rd
- 2120 Banks Dairy Rd
- 569 Anderson Parrish Rd
- 567 Anderson Parrish Rd
- 0 Ben Grady Collins Rd Unit LOT 3 10534788
- 0 Ben Grady Collins Rd Unit LOT 1 10534784
- 788 Dean Nichols Rd
- 3969 Ben Grady Collins Rd Unit LOT 2
- 3035 Cowboy Way
- 0 Dean Nichols Rd
- 188 Brenda Rd
- Lot 3 Ben Grady Collins Rd
- Lot 1 Ben Grady Collins Rd
- 27100 Us Highway 80 W
- 413 Portal Crossing Loop
- 569 Portal Crossing Loop
- 27126 U S 80
- 27126 Us Highway 80 W
- 566 Portal Crossing Loop
- 0 Portal Crossing
- 27130 Us Highway 80 W
- 565 Portal Crossing Loop
- 13 Railroad Street Extension
- 27130 U S 80
- 27167 Us Highway 80 W
- 27179 Us Highway 80 W
- 27167 Us Highway 80 W
- 27179 Us Highway 80 W
- 507 Portal Crossing Loop
- 27125 U S 80
- 27125 Us Highway 80 W
- 9 Railroad Street Extension
- 27012 Us Highway 80 W